
Dividend yield is an important factor in determining the true value of dividend stocks. This fact holds especially true when investors are seeking to derive dividend income from their investments.
What Is Dividend Yield?
Dividend yield is an easy way to compare the relative attractiveness of various dividend-paying stocks. It tells an investor the yield he/she can expect by purchasing a stock. Dividend yield is the relation between a stock’s annual dividend payout and its current stock price. Depending on how much a stock price moves during the day, the dividend yield is constantly changing as the price of the stock changes.
Most solid companies pay a quarterly dividend that is somewhat predictable to investors. These companies typically pay a regular quarterly dividend around the same times every year. Many of these companies raise their dividends once a year – finding themselves on 10-year dividend increasers and Dividend Aristocrat lists.
For a company that has a stock price that is trending upward, it will need to raise its dividend payout in order to maintain its dividend yield. For example. if a stock goes up by 50%, but does not raise its dividend, its yield will drop significantly
How to Calculate Dividend Yield
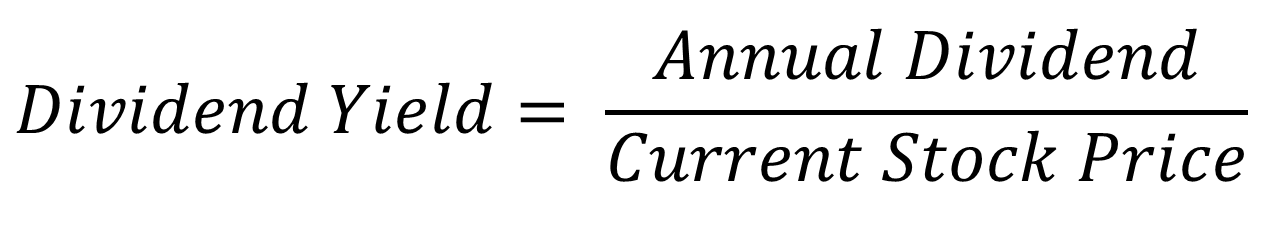
To calculate dividend yield, use the dividend yield formula. This can be done by dividing the annual dividend by the current stock price:
For example, if stock XYZ had a share price of $50 and an annualized dividend of $1.00, its yield would be 2%.
$1.00 / $50 = .02
When the 0.02 is put into percentage terms, it would make a 2% yield.
If this share price rose to $60, but the dividend payout was not increased, its yield would fall to 1.66%.
The dividend yield is calculated using the annual yield (every regular payout paid that year). It is not calculated by using quarterly, semi annual or monthly payouts.
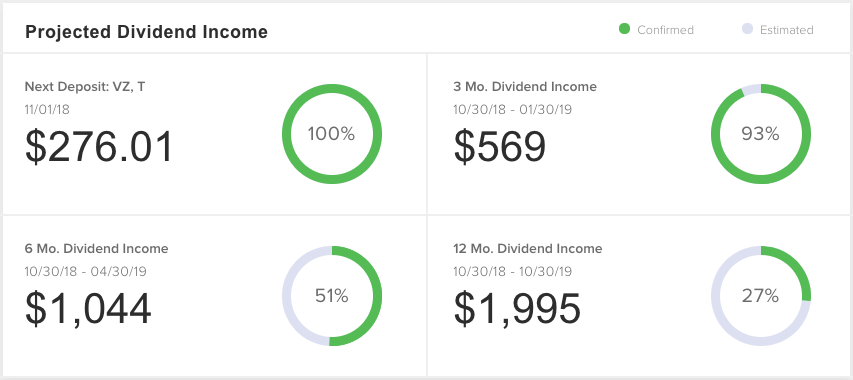
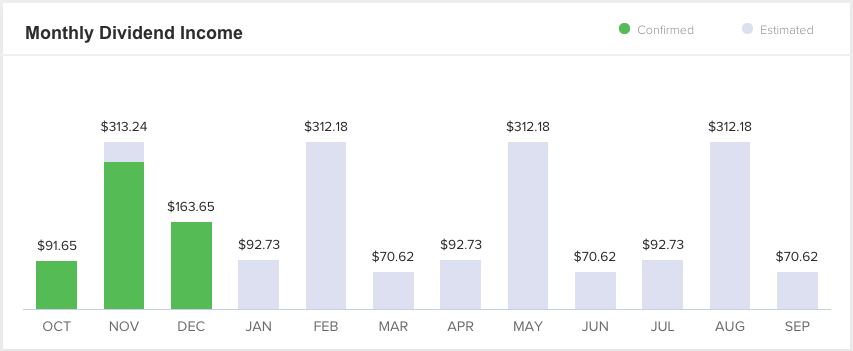
To better estimate your future dividend income, be sure to check out our Dividend Assistant tool. It’s free to use. The Dividend Assistant tool allows you to link your brokerage account or manually add your holdings in order to organize and track all dividend income for the upcoming 12 months. Investors can visualize the size of their dividend payments, which holding(s) the payment is from, and the certainty of the payment (confirmed vs estimated). Check out the sample portfolio screenshots below.
Beware: High-yield dividend stocks can be a trap!
An investor desiring to put together a portfolio that generates high dividend income should place great scrutiny on a company’s dividend payment history. Only those corporations with a continuous record of steadily increasing dividends over the past 20 years or longer should be considered for inclusion. Furthermore, the investor should be convinced the company can continue to generate the cash flow necessary to make the dividend payments.
If you look at the subprime mortgage mess from 2007-2009, companies were sometimes showing yields in the 10%-20% range, but that was only because the stock price had been hit hard, which resulted in a higher dividend yield. So, be careful when you are excited about jumping into a stock, just because the yield may be high.
When analyzing a high yield dividend stock, it is always important to determine why the stock’s yield is so high. There are two reasons why a stock may have an above average yield.
1. The stock price has taken a hit
When a stock price declines and the dividend payout remains the same, the dividend yield will increase. For example, if stock XYZ was originally $50 with a $1.00 annual dividend, its dividend yield would be 2%. If that stock’s share price fell to $20 and the $1.00 dividend payout was maintained, its new yield would be 5%. While this 5% dividend yield may be attractive to some dividend investors, this is a value trap.
It is always important for investors to understand why a stock’s yield is abnormally high. A company that has a stock price that has fallen from $50 to $20 is probably struggling and should not be considered a solid investment.
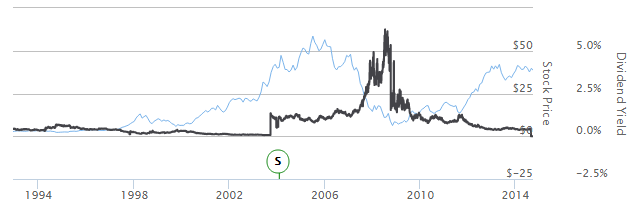
An example of this situation is the home builder stocks during the 2008-2009 financial crisis. The chart below shows an inflated dividend yield for Lennar (LEN ) during the financial crisis. The blue line shows the company’s falling stock price while the black line shows its rising dividend yield. Be sure to also read Comparing Average Dividend Yield by Sector.
2. Is It a REIT or an MLP?
Real Estate Investment Trusts and Master Limited Partnerships are very popular among dividend investors as they tend to offer much higher dividend yields than stocks. These companies tend to offer high dividends since they are required to distribute at least 90% of earnings to shareholders in the form of dividends. These companies do not pay regular income tax on a corporate level, instead the tax burden is passed down to the investor.
If you are not familiar with these types of investments, please check out the following guides:
- Everything Dividend Investors Need To Know About MLPs
- The Definitive Guide to REITs
- The Complete Guide to REIT Taxes
Premium members also have access to in-depth reports explaining these two investments. These reports can be found here.
Dividend-Friendly Industries
Investors should also keep dividend-friendly industries in mind. Below are five of the best industries for dividends:
Be sure to also check out 4 Dividend-Friendly Industries.
Key Lessons in This Chapter
- Dividend yield is an important consideration for investors, since it represents the annualized return a stock pays out in the form of dividends.
- Investors looking for income from dividend stocks should concentrate on stocks that have at least a 3% dividend yield.
- Investors should also consider the traps mentioned above to avoid unnecessary risk.
- Most stocks with a dividend yield of 10% or higher are very risky, since a dividend cut is likely in store.
To view Dividend.com’s Highly Recommended list of stocks that meet these key requirements, be sure to check out our Best Dividend Stocks List. The list features Dividend.com’s top-rated dividend stocks, geared toward traditional long-term, buy-and-hold investors. All stocks on this list are rated using Dividend.com’s proprietary Dividend Advantage Rating System – DARS™. Refer the below screenshot of our partial list, which gets updated each week.
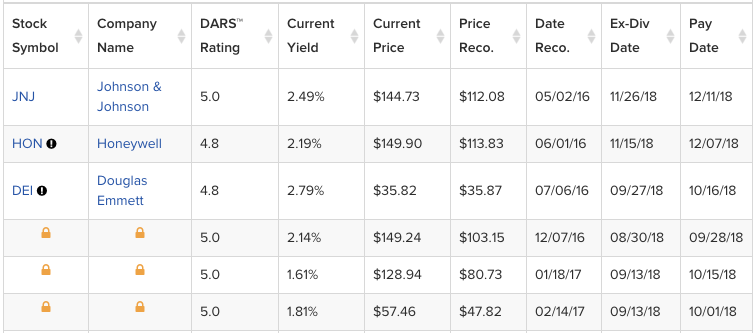
We generate a weekly report on a stock from our Best Dividend Stocks List. Check out a free sample report on Johnson & Johnson (JNJ ), in which we discuss how JNJ performs on the five metrics of our proprietary Dividend Advantage Rating System – DARS™.
Related Articles
- Dividend Investing 101
- What is a Dividend Reinvestment Plan?
- Dividend Dates Explained: Ex-Dividend, Record, Payment & Declaration Date
Also, check out Dividend.com’s tools. Our tools help investors make sound investment decisions. Investors can narrow down their stock investment search by screening, comparing and analyzing the vast universe of dividend-paying stocks.


