The key to building a solid portfolio is to determine exactly how much risk you are willing to take on to get a reward. More simply put, investors must practice sound risk management. The means of achieving this “perfect blend,” however, can vary from person to person.
Though there is no perfect formula for achieving a well-balanced and diversified portfolio, what we can do is better position ourselves for those volatile days on Wall Street by being able to identify where the risks lie within our portfolios.
Risk Measurement: Conventional Metrics
To begin, it is important for investors to know the conventional measurements of risk and risk management. Not only should investors know how to find each of these risk metrics, but they should also know what each one means. Below, we highlight a few statistical metrics that investors can use to identify risk.
Beta
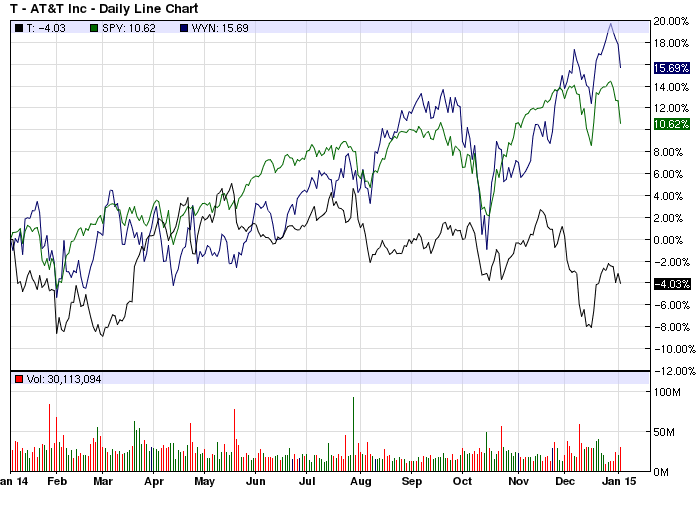
This metric measures the level of volatility of a security or portfolio in relation to the market as a whole. Without getting into too many details, beta risk describes a stock’s (or portfolio’s) “sensitivity” to market swings. The whole market (think S&P 500) has a beta of 1, so if a stock has a beta greater than 1, this means the security will be more sensitive to volatility. Conversely, if a stock has a beta less than one, then it is less likely to exhibit volatile price swings. Below is a graph of Wyndham Worldwide (WYN), which has a beta of 1.56, versus AT&T (T ), which has a beta of 0.36.

As the chart shows, the high beta stock exhibits significantly more volatility than the low beta stock, especially when comparing it to the S&P 500.
Correlation
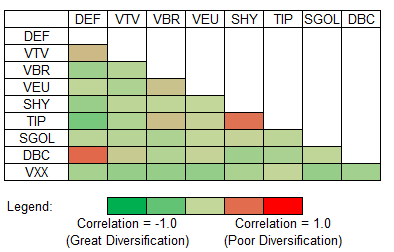
Similar to beta, this metric also ranks a stock’s “sensitivity,” but it does so relative to another security instead of the whole market. A correlation coefficient can range from -1 to 1, where a perfect positive correlation (1) implies that two stocks move up or down together, while a perfect negative correlation (-1) implies that two stocks move completely opposite of each other. In real life, there are essentially no “perfect” correlations, but the metric can still be helpful when trying to build a diversified portfolio. Tip: Several trading platforms have tools to build correlation matrices, which is a great way to visualize risk in your portfolio. An example of this can be seen in the picture below:

Historical Volatility
Usually presented as 5-, 20-, 50-, or 200-day volatility, this metric is a bit more backward looking, but it can still be useful. The metric reflects a stock’s past price movements, meaning it measures the stock’s actual or realized volatility. Often, investors use the “longest” measure (200 day) of a stock and compare it to a particular index’s volatility metric. Again, since this is based on historical numbers, the metric is limited, but it can give some insight into a particular stock’s short-term price behavior [see also The Ten Commandments of Dividend Investing].
Standard Deviation
Standard deviation is also considered to be a great metric of historical volatility. It measures how much an investment’s return can vary from its average return. In finance, typically you will see standard deviation applied to the annual rate of return of an investment. If a stock has a high standard deviation, it means that it is more likely to exhibit more volatile returns, which are further away from the stock’s average annual return [see our Best Dividend Stocks].
Portfolio Biases
In addition to the conventional risk metrics, investors should also realize that a portfolio with a heavy allocation towards either a particular stock or corner of the market can also increase the overall level of risk in a portfolio.
There are several different biases investors should look for when constructing or re-balancing a portfolio:
- Single Stock Bias: This occurs when a single security makes up a significant portion of a portfolio; think double-digit allocations. This means that the performance of a single stock will have a big impact on bottom line returns. While this is not necessarily a bad thing, investors should be comfortable with the risk/return profile of such a top-heavy portfolio.
- Multi Stock Bias: Multi-stock biases are a bit harder to spot. This occurs when a handful of securities (perhaps 2-5 stocks) are allocated a significant weighting in the portfolio.
- Sector/Industry Bias: Sometimes, portfolios are heavily skewed towards a particular industry or sub-sector of the market. These are also sometimes hard to spot, but recognizing how much you are invested in one corner of the market is crucial.
- Country Bias: Even if you are invested in only U.S.-listed stocks, investors must be aware that many of the firms on Wall Street today are highly interconnected with other parts of the world. For example, roughly one-quarter of all of IBM’s sales comes from the Asia Pacific region (see 7 Big-Name Dividend Stocks: An International Sales Overview).
While these biases can sometimes work in an investor’s favor, the overall level of risk is much higher for portfolios that have these biases. Investors should be aware and comfortable with these biases, and should always be ready to scale into or out of positions if the heavy allocation becomes too risky.
Dividend-Specific Risks
One of the biggest risks dividend investors encounter are what are called dividend traps. In general, a dividend value trap occurs when a very high dividend yield attracts investors to a potentially troubled company. To spot these traps, investors should look for he following warning signs:
- High payout ratios
- Falling cash flow growth
- Limited cash
- Large debt burdens
- Layoffs
- Earnings misses
- Reduced guidance and estimates
- General industry softness
Be sure to read How to Spot a Dividend Value Trap.
Dividend consistency is also a key factor for investors. A company that has consecutively increased its dividends for a number of years is typically a sign of a fundamentally-sound and less-risky company. If a company has either decreased or suspended dividend payments, this is often a sign of a troubled and high risk company.
The Bottom Line
With these tools, investors can more easily identify the level of risk within their portfolios. While it may seem a bit overwhelming, measuring risk and staying on top of your risk exposure can certainly save you in the long run.
Be sure to visit our complete recommended list of the Best Dividend Stocks, as well as a detailed explanation of our ratings system here.


