
ExxonMobil Corporation (XOM ) is one of the largest energy companies in the world, with a current market capitalization of over $330 billion.
ExxonMobil is the largest publicly traded international oil and gas company that uses technology and innovation to help meet the world’s growing energy needs. The company holds an industry-leading inventory of resources and is one of the world’s largest integrated refiners, marketers of petroleum products and chemical manufacturers. ExxonMobil can trace its roots back to 1859, when Colonel Edwin Drake and Uncle Billy Smith drilled the first successful oil well in Titusville, Pennsylvania. This discovery helped trigger an oil boom that brought both the energy industry and the country into a new frontier.
ExxonMobil has remained profitable in a lower-priced oil environment due to its lower-cost reserves, thanks to investments in oil sands and liquefied natural gas. Nearly 50% of total production comes from the company’s longer-term assets, which will help keep ExxonMobil ahead of its peer group. The company is broken down into three segments: upstream, downstream and chemical. What makes XOM so successful compared to its peers is that it integrates all three sectors, which creates synergies that add maximum value and flexibility to capture new opportunities.
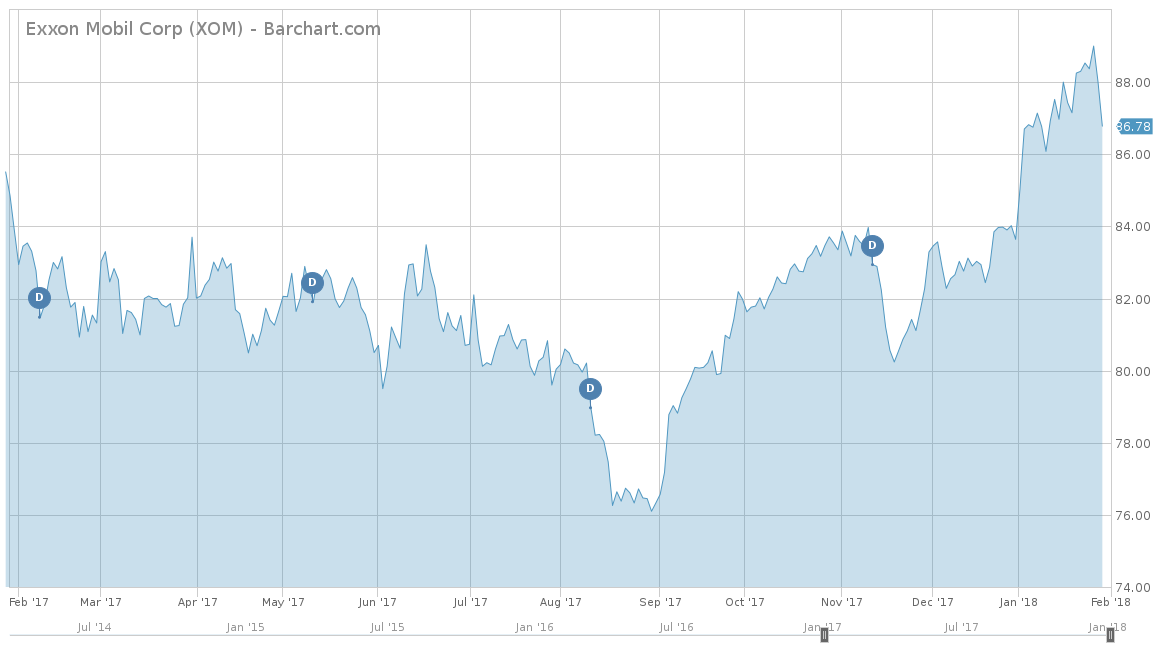
So far for 2018, ExxonMobil has had a good start. However, it was unable to escape the the first major sell-off in the U.S market last week. In addition, for 2017 XOM was one of the few losers in an otherwise bullish market. For 2017, the stock had a negative return of 3.94%, which was considerably lower than the S&P 500’s 2017 return of 19.42%. Over the longer term, XOM has also underperformed the S&P 500, with a cumulative return of negative 12% versus the S&P’s return of 75% over the last five years. When compared to its peer group using the Energy Select Sector SPDR® Fund (XLE), XOM still demonstrated underperformance. Year-to-date, XLE is up 3.42% while down 0.90% for 2017. Over the trailing five years, XLE was down 3.37%, while XOM was down more than 12%. However, both ExxonMobil and XLE had their returns tied to the price of oil, which was once trading well over the $100-per-barrel mark five years ago and is now trading between $60 to 70 per barrel today.
Fundamentals
Like the stock price, ExxonMobil has struggled to maintain revenue growth. Over the last five years, the company averaged a negative 14.2% for its revenues. In fact, over the last five years, XOM has not seen a positive revenue growth since 2011. However, 2017 looks to be a turning point so far for ExxonMobil through the first three quarters of the year, with the company on track to beat its 2016 results. Analysts estimated that revenues for 2017 will total $271.4 billion, making it a 20% increase from 2016’s measure. However, on Friday, February 2, 2018, ExxonMobil announced total year-end revenues for 2017 at $244 million, only an increase of 7.6% from 2016. Analysts expect XOM to continue its positive revenue momentum in 2018 as well, with expectations of a $315.2 billion revenue, which is more than a 25% jump over 2017 estimations.
From an earnings-per-share (EPS) perspective, ExxonMobil has had an even worse performance than its revenues. Over the last five years, the company has a negative 25.9% average EPS growth. However, most of this is attributed over the last two years; where 2015 saw a drop off of 49.3% and 2016 with a decline of 51.2%. But like its revenues, analysts were again very optimistic with Friday’s reporting and expected 2017’s total EPS to measure around $3.68 per share. However, XOM reported a much higher estimated EPS of $4.63 for 2017. Analysts expect more of the same in 2018, with estimates coming in at $4.57 per share. However, expect this to be adjusted since ExxonMobil’s recent earnings beat.
From a price-over-earnings perspective, XOM comes in at around 27, which is higher than the 26.46 of the S&P 500. However, when compared to XLE, which has an average P/E ratio of 32.0, XOM’s P/E looks quite attractive.
Strengths
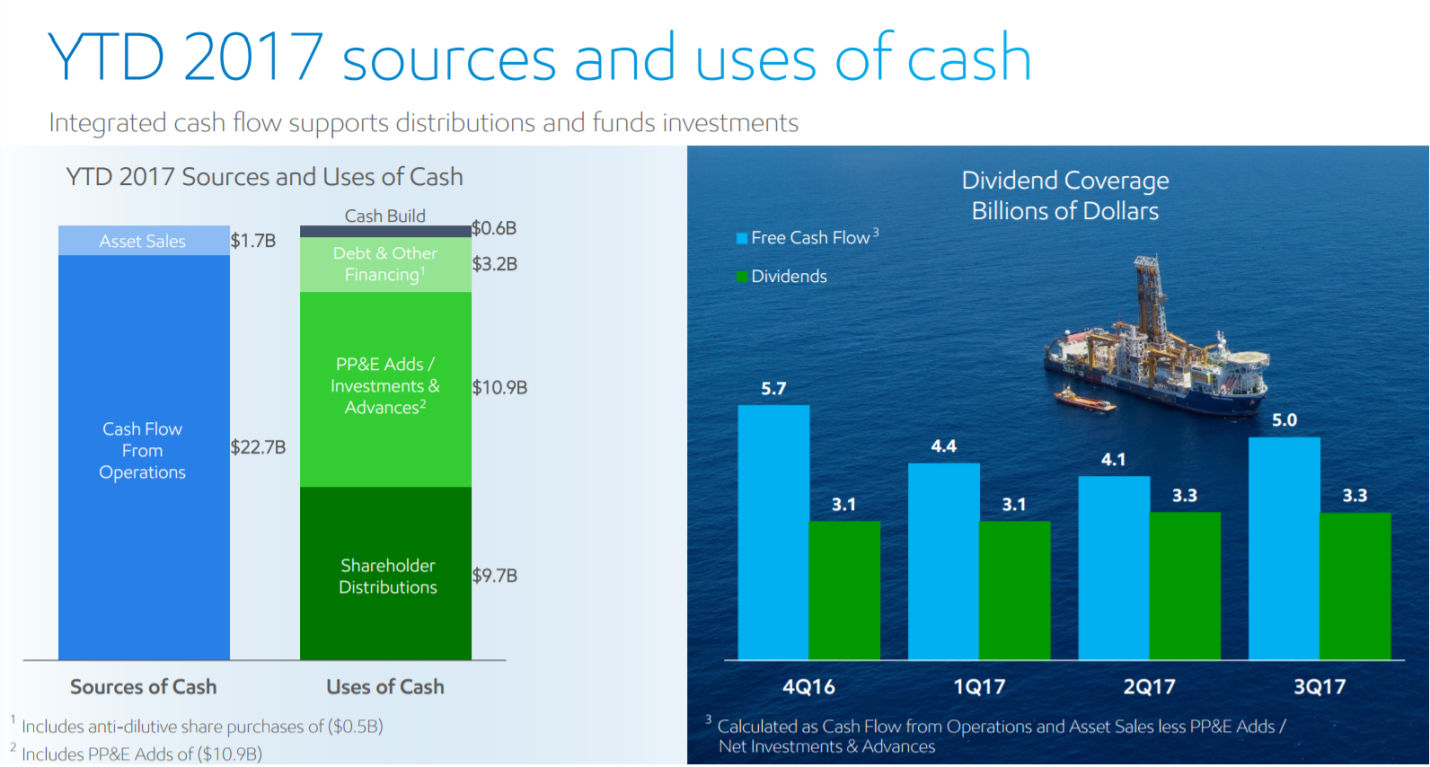
Like its competitors in the energy industry, ExxonMobil has suffered with the rapid decline of oil prices over the last five years. Although it has been struggling with revenues and earnings, the company still remained profitable, with its cash flows often outweighing the company’s spending. This financial prudence has allowed the company to fund both capital expenditures into future projects as well as shareholder distributions in the form of dividend increases.
Management has also made it a major focus for the company to be successful in any environment. This was specifically evident in the third quarter of 2017, when the company was forced to shut down its operations in Baytown, Mont Belvieu and Beaumont, which were all affected by Hurricane Harvey. Although about $160 million of earnings were impacted, overall the hurricane had very little impact on upstream operations.
Growth Catalyst
The major growth for ExxonMobil will stem from its investment opportunity pipeline that has been established from 2018 to 2020. Its short-cycle upstream projects like the Permian and Bakken have been quite profitable.
XOM’s longer-cycle upstream projects like Tengiz, Liza and the Guyana expansion are also showing signs of profit potential. The company specifically hopes to strengthen its position in South America through Guyana and Brazil, which should add to another high-yielding portfolio to XOM’s diverse projects. In Brazil alone, ExxonMobil has secured approximately 2 million gross acres across 12 blocks of deep water. It has also commenced 3D seismic acquisition for 2018 while expecting to drill as soon as 2019.
If XOM can find additional ways to increase the margins on their already low oil-per-barrel reserves, expect the company to continue to increase its margins and profitability.
Dividend Analysis
Although XOM’s stock has been struggling over the last five years, the company has maintained its commitment to its shareholders by continually increasing its dividend for the last 35 years in a row. The stock currently yields 3.98% for an annualized payout of $3.08 per share. This yield is considerably higher than the 3.11% average yield of the major integrated oil and gas industry or XLE’s yield of 3.04%. If analysts are correct in their estimates for 2017 and 2018, expect ExxonMobil to raise its dividend for another consecutive year.
To find more high-quality dividend stocks, check out our Dividend Screener. You can even screen stocks with DARS ratings above a certain threshold.
Risks
Like most of the other energy companies, ExxonMobil’s largest risk is commodity risk. Over the last quarter of 2017, oil prices have been steadily increasing, benefiting XOM’s revenues. If oil drops below the $60-per-barrel range, then so will ExxonMobil’s profit margins.
Another potential risk for ExxonMobil that isn’t as prevalent to the energy industry as commodity risk is the threat of natural disasters. In 2017 alone, there were three major hurricanes that hit the United States. Hurricane Harvey caused the most damage to the energy industry, with catastrophic damage in the Texas and Louisiana regions.
The Bottom Line
Over the last five years, ExxonMobil as a stock has vastly underperformed the broad market. However, now that the company is projected to be back to positive revenue and earnings growth, expect the stock to follow on the good news.
Check out our Best Dividend Stocks Page by going Premium for free.


