
Investors considering the lofty stock and bond market prices may be wondering what will happen as the Fed continues to raise interest rates and begins to unwind their portfolio.
With the Fed’s balance sheet now at a massive $4.5 trillion, it is clear that any mistake or aggressive action by the Fed could reverberate across investors in the U.S. and abroad.
Want to know what the Fed’s rate hike means for dividend investors? Find out here.
So, How Did We Get Here and What Comes Next?
First, a little history is in order.
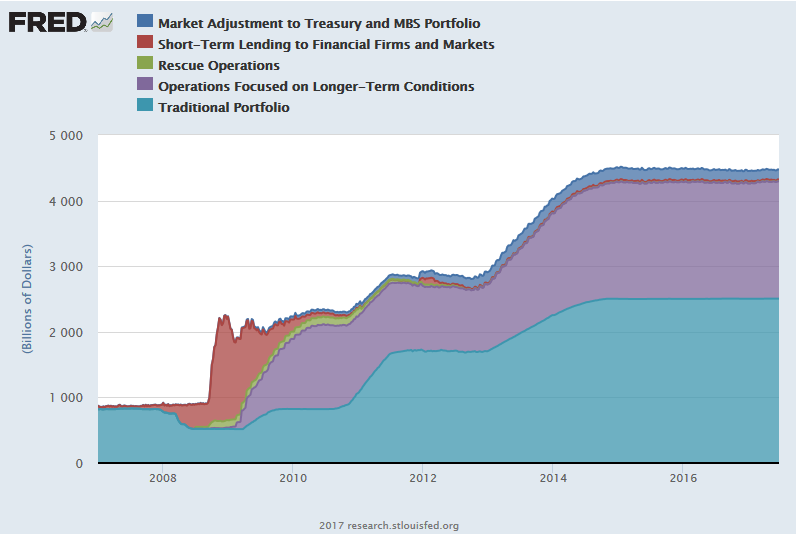
Data from the St. Louis Federal Reserve shows how the Fed’s balance sheet has ballooned from less than $1 trillion in 2007 to roughly $4.5 trillion today. As the graph below shows, this portfolio is mostly made up of an expanded traditional portfolio of the Fed and securities held from operations focused on the longer term. The traditional assets are primarily U.S. Treasury securities. The long-term operations account includes agency securities and mortgage-backed securities, discount window lending, lending to other institutions, assets of limited liability companies that have been consolidated onto the Federal Reserve’s balance sheet, and foreign currency holdings associated with reciprocal currency arrangements with other central banks such as foreign central bank liquidity swaps.
The Fed’s balance sheet continued to grow until early December 2014, at which point changes in Fed policy led to the tapering off of asset growth. Now, of course, with a $4.5 trillion portfolio, there are always changes in value on any given day – sometimes those changes increase the value and sometimes they decrease it. At this stage though, the Fed is not looking to add new assets to its portfolio.
Since 2014, the Fed has maintained the size of its portfolio by reinvesting coupon payments received from bonds, and rolling over their investment in maturing bonds. That is starting to change though. The Fed is now officially preparing to begin winding down its portfolio.
Click here to read why investors should not fear higher interest rates.
Impacts on the Markets
The impact of the Fed’s decision to wind down its portfolio on the markets is impossible to gauge with certainty, but history provides some guidance. In particular, as the Fed was building its portfolio, certain asset classes became distorted, and that process may reverse as the Fed rewinds in the future.
Treasuries are probably the asset class most impacted by the Fed’s asset buildup process. As the Fed’s balance sheet swelled, Treasuries became more expensive. But other asset classes have also been impacted. Investors fleeing Treasuries have moved into equities and corporate bonds, pushing those asset classes to new highs since the financial crisis.
As the Fed begins to unwind its balance sheet, investors may slowly leave equities and corporate bonds, and more private money may flow into Treasuries again. In turn, that could create headwinds for these asset classes that have done so well over the last few years. The process of unwinding the Fed’s balance sheet will work similar to a tightening monetary policy leading to an increase in interest rates. The borrowing costs of companies, as well as individuals, go up, which may impact capital spending and consumption in the economy.
Janet Yellen described the unwinding process in her most recent press conference saying, “Initially, these caps (which determine the amount of assets allowed to mature and not be rolled over on the Fed’s balance sheet) will be set at relatively low levels, $6 billion per month for Treasuries and $4 billion per month for agencies. So any proceeds exceeding those amounts would be reinvested. These caps will gradually rise over the course of a year to maximums of $30 billion per month for Treasuries and $20 billion per month for agency securities, and will remain in place through the normalization process." The Fed believes that with this approach to limit the volume of securities as “private investors will have to absorb as we reduce our holdings, the caps should guard against outsize moves in interest rates and other potential market strains.”
Check out our Best Dividend Stocks page by going Premium for free.
While Yellen declined to state what the Fed’s eventual balance sheet size will be, some reports have floated a figure of roughly $2.5T. To get to that level of balance sheet from $4.5T would require 40 months of drawdowns at $50B per month. In other words, the Fed’s unwinding of its balance sheet is a process that will take years.
The reality is that no one knows exactly how the Fed’s unwinding of its balance sheet will work – nothing of this magnitude has ever been attempted in the history of the Fed. It is clear that consumers and investors should expect a rising interest rate environment over the next few years as the Fed raises its short-term interest rate target, and those moves are reinforced by the drawdown of the balance sheet. In particular, a lower Fed demand for Treasuries will reduce prices and raise rates. Overall, this will raise interest rates across the economy. Capital-intensive industries that rely most on borrowed funds are going to be the ones most impacted by this change.
Check out what the investors are currently most interested in by visiting our Most Watched Stocks page.
The Bottom Line
The bottom line for investors is that the Fed’s actions are going to have an outsized impact on Treasuries and agency securities, and indirectly that will impact corporate bonds and equities. The faster the Fed chooses to wind down its balance sheet, the bigger the impact will be on the markets. For now, the top speed the Fed is talking about unwinding at is $50B per month across Treasuries and agencies. At that pace, the unwinding process would take about three and a half years. Investors should buckle up for the long haul.
Stay up to date with the highest-yielding stocks and their latest ex-dividend dates on our High Dividend Stocks by Yield page.


