
The amount of ink spilt, including the digital equivalent, on what has happened in the oil markets the past six months is probably unprecedented given our highly connected, digital age. Everyone’s got a take. Including us.
The stream of bottom ringers has been consistent since $95, let alone $75. This past week the key WTI price pierced $50 (at the time of writing, it was <$49) for the first time since the depths of the 2008-2009 financial crisis.
Where does it end?
Well, the right answer in both the short and likely medium term is “no one knows.” Anyone who tells you they do is literally lying to you. They don’t. And trust us, there will be no shortage of those selling you on their near term opinions. While a sound argument for the long-term price—that being the marginal cost of production—makes sense, dear reader, the market can stay irrational a lot longer than you can stay solvent – a loosely quoted sentiment most often attributed to Keynes.
What to Do, Whom to Believe?
Ultimately, as long-term dividend investors, we use a framework like this when we think about trends. The recent January edition of the respected letter from Absolute Return Partners puts the framework well to develop context for a discussion:
I (Niels C. Jensen) distinguish between three time horizons when investing:
- Very short term (mostly technical factors)
- Short to medium term (mostly cyclical factors)
- Long term (mostly structural factors)
When we think about the absolute rout in oil we think about it in this context and ultimately need to forecast (that’s a scary word just to type) the long term trends, and given said forecast, we think about how it affects the holdings of a long-term dividend oriented investor. Is the recent 50% drop a secular trend?
A lot of people are trumpeting 10- or even 20-year oil charts, which is not a long enough time frame for secular context. Here’s a longer one: it’s 65 years. I got this chart from Forecast-Chart.com and took some liberties with it, specifically smoothing out the most recent movement from >$100 to ~$50.
Note this chart is in logarithmic scale in an effort to better illustrate the magnitude of each swing, in percentage terms, over time:
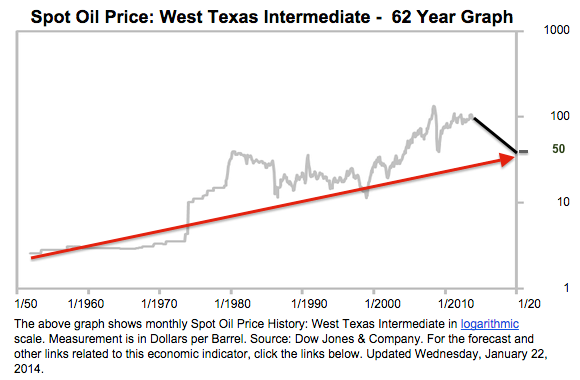
Every dip (including a 50% drop!) needs to renew and re-examine the debate around why or if this may not be a cyclical trend, but rather secular. That’s an analysis we’re working on, but given the power of the chart above and the 65-year upward trend in oil prices, we see this as yet another cyclical drop. With that said, we hold the right to change our opinion if / when the facts change (to loosely quote Keynes again, although our pal @JasonZweig aptly noted the inability of anyone to pinpoint Keynes as the source).
Have a great weekend and talk to you Monday.


