You take care of your investments. We like that.
Upgrade to Premium to access your Watchlist and more.

COLONY BANKCORP INC
Stock (NYSE)
CBAN
Payout Change
No Change
Price as of:
$20.57
+0.33
+0%
Dividend (Fwd)
$0.48
Yield (Fwd)
Annualized forward dividend yield. Multiplies the most recent dividend payout amount by its frequency and divides by the previous close price.
2.33%
CBAN: NYSE (Stock)
COLONY BANKCORP INC
Payout Change
No Change
Price as of:
$20.57
+0.33
+0%
Dividend (Fwd)
$0.48
Yield (Fwd)
Annualized forward dividend yield. Multiplies the most recent dividend payout amount by its frequency and divides by the previous close price.
2.33%
CBAN: NYSE (Stock)
COLONY BANKCORP INC
$20.57
+0%
Dividend (Fwd)
$0.48
Yield (Fwd)
Annualized forward dividend yield. Multiplies the most recent dividend payout amount by its frequency and divides by the previous close price.
2.33%
Payout Change
No Change
Analysis
Name
As of 11/09/2026Price
Aum/Mkt Cap
YIELD
Annualized forward dividend yield. Multiplies the most recent dividend payout amount by its frequency and divides by the previous close price.
& DIV
Exp Ratio
Expense ratio is the fund’s total annual operating expenses, including management fees, distribution fees, and other expenses, expressed as a percentage of average net assets.
Watchlist

How to Read a CEF's Section 19(a) Notice and Tell Good Return of Capital From Bad

Hurricane Season Is Ending Quietly. What That Means for Catastrophe Bond Funds

The Midterms Are Settled. Here's What a Democratic Congress Means for Fund Investors
Dividend Data
Stock Data
Avg Price Recovery
7.3 Days
Payout Ratio (FWD)
Fwd Payout Ratio is used to examine if a company’s earnings can support the current dividend payment amount. It divides the Forward Annualized Dividend by FY1 EPS. Click here to learn more.
20.08%
Years of Dividend Increase
Consecutive Years of Dividend Increase is the number of years in a row in which there has been at least one payout increase and no payout decreases.
2 yrs
Dividend Frequency
Quarterly
Financials Avg Yield
N/A
Market Cap
$0.423 B
Day’s Range
$20.41 - $20.85
Volume
245,887
52 Wk Low/High
$16.0 - $22.46
Percent off 52 Wk High
-8.41%
FY1 PE
8.61x
FY1 EPS / Growth
$2.39 / 15.46%
Name
As of 11/09/2026Price
Aum/Mkt Cap
YIELD
Annualized forward dividend yield. Multiplies the most recent dividend payout amount by its frequency and divides by the previous close price.
& DIV
Exp Ratio
Expense ratio is the fund’s total annual operating expenses, including management fees, distribution fees, and other expenses, expressed as a percentage of average net assets.
Watchlist
Featured Dividend News, Stocks, ETFs, Funds
View all
How to Read a CEF's Section 19(a) Notice and Tell Good Return of Capital From Bad
Hurricane Season Is Ending Quietly. What That Means for Catastrophe Bond Funds
The Midterms Are Settled. Here's What a Democratic Congress Means for Fund Investors
CBAN's Next Dividend
Declared
Amount Change
0.0%
No Change
Next Amount
$0.1200
Next Pay Date
Nov 25, 2026
Type
Regular
Freq
Quarterly
Last Amount
$0.1200
Last Pay Date
Aug 19, 2026
Type
Regular
Freq
Quarterly
Dividend Shot Clock®
The time remaining before the next ex-dividend date. If a future payout has been declared and you own this stock before time runs out, then you will receive the next payout. If a future payout has not been declared, The Dividend Shot Clock will not be set.
Ex-Date: Nov 10, 2026
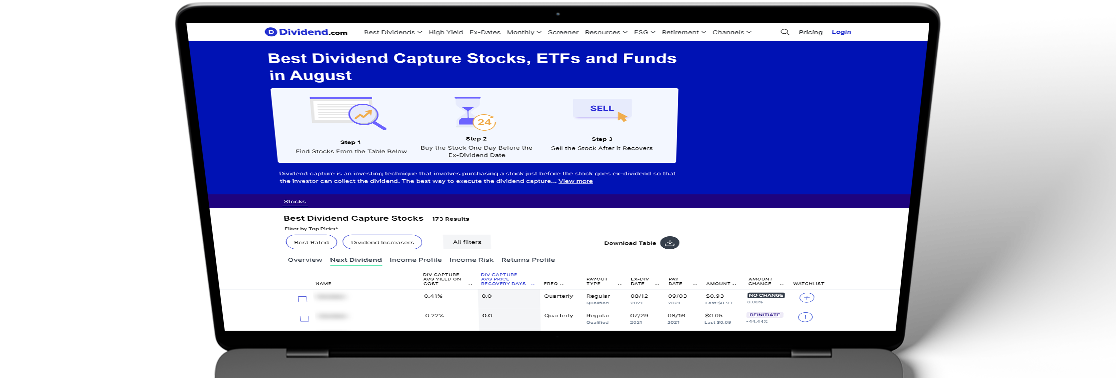
Dividend Capture Strategy for CBAN
Dividend capture strategy is based on CBAN’s historical data. Past performance is no guarantee of future results.
Step 1: Buy CBAN shares 1 day before the ex-dividend date
Purchase Date
Nov 09, 2026
Upcoming Ex-Dividend Date
Nov 10, 2026
Step 2: SEll CBAN shares when price recovers
Sell Date (Estimate)
Nov 18, 2026
Avg Price Recovery
7.285714285714286 Days
Avg yield on cost
0.66%
© 2020  Market data provided is at least 15-minutes delayed and hosted by Barchart Solutions.
Information is provided ‘as is’ and solely for informational purposes, not for trading purposes or advice, and is delayed. To see all exchange delays and terms of use, please see disclaimer
CBAN Payout History (Paid, Declared and Estimated)
Declared
Paid
Estimated
| Year | Calendar Year Payout (USD) | Calendar Year Payout Growth | Pay Date | Declared Date | Ex-Dividend Date | Payout Amount (USD) | Qualified Dividend? | Payout Type | Frequency | Days Taken For Stock Price To Recover | Yield on Cost |
|---|