Finding “cheap,” yet fundamentally-sound companies is a daunting challenge for any dividend investor. One way to go about finding bargains that also boast long-term potential is to undertake a contrarian approach in your security selection process.
David Dreman, an often overlooked Wall Street legend, championed the idea of buying “out-of-favor” securities in an effort to outperform the broad market over the long-haul; that is to say, his contrarian strategy was rooted in finding bargain stocks in corners of the market that were often deemed as the “most hated” by the majority. Although this approach gives great weight to market psychology, there are ways to utilize the various valuation metrics out there to assist with quantifying and taking advantage of “out-of-favor” securities [see also Free Lunch on Wall Street: 21 Ways Investors Can Make (and Keep) More Money].
One of the ways to go about finding bargains in the equity market is to narrow your focus to historically fundamentally-sound companies that also happen to boast a low price-to-book ratio.
Price-to-Book Ratio Explained
What is the price-to-book ratio and why is it important for contrarians? Price-to-Book, or P/B for short, is a popular valuation metric that is calculated by dividing a company’s share price by the book value of its equity. Simply put, the book value of a firm is the value of the company’s assets taken directly from the balance sheet; this figure is defined as the difference between the book value of assets and the book value of liabilities.
The P/B ratio is important for contrarian investors because it can serve as a gauge as to whether or not a company is over or undervalued. For simplicity’s sake, a low P/B ratio could imply one of two things; first, it could be interpreted as a sign that the current market price is not reflective of the underlying value, and the stock might therefore be deemed as “undervalued.” On the other hand, a low P/B ratio could also serve as a warning sign that something is fundamentally wrong with the company, seeing as how its underlying assets aren’t able to generate meaningful earnings growth to attract investors.
The Motley Fool offers a thorough explanation of the P/B ratio’s uses and nuances that should be taken into consideration before incorporating this valuation metric into your investment strategy.
Below, we’ll take a look at how this ratio can be used as a gauge to identify opportune times to buy into historically fundamentally-sound companies. Please note that the examples below assume perfect hindsight as they are based on the last five years of trading data; also note that the historical stock P/B values featured in each of the graphs below the price history are courtesy of YCharts.com.
General Electric {% dividend GE %}

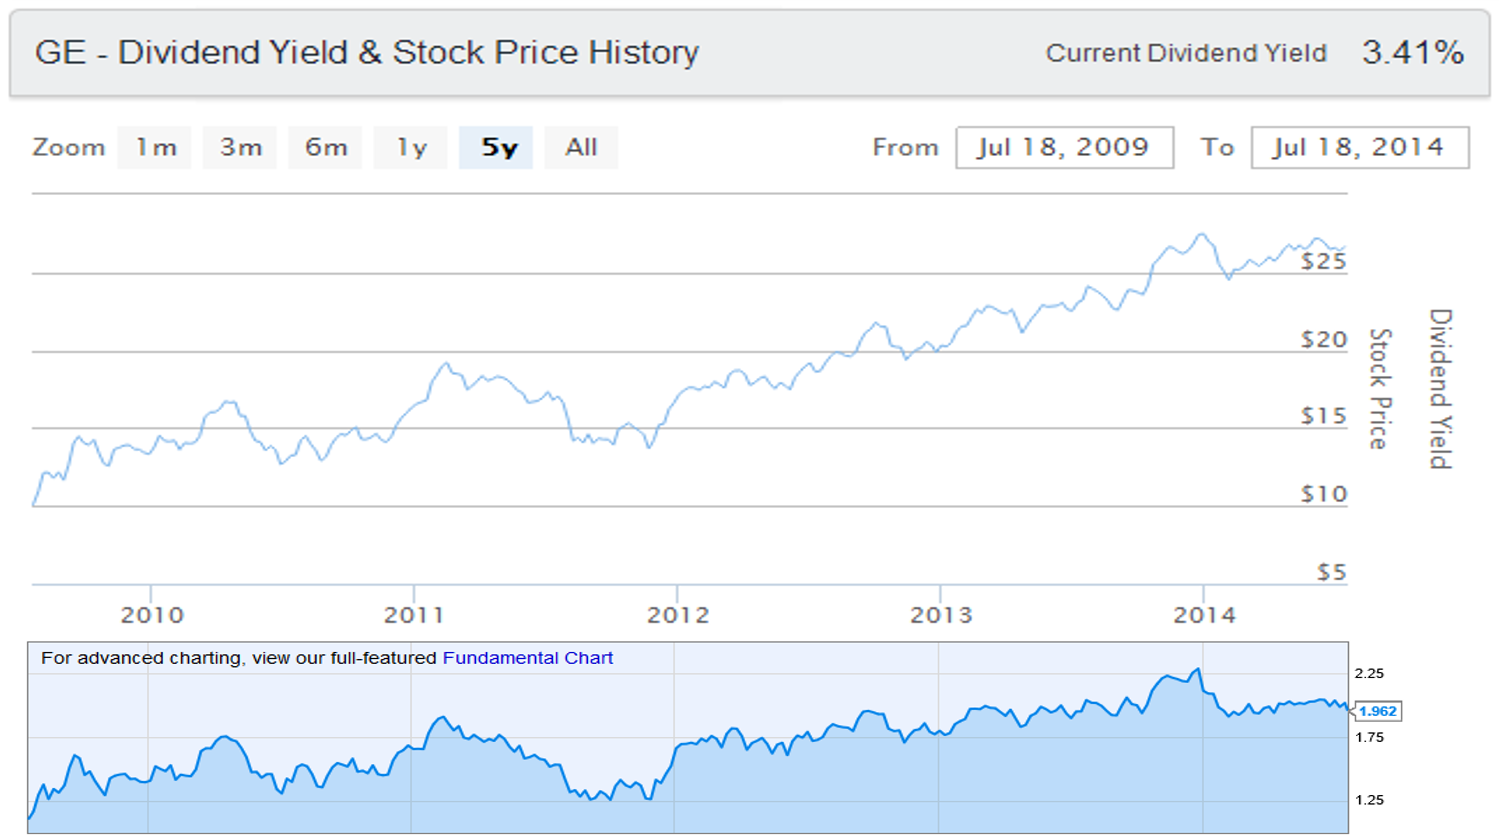
In the case of General Electric, a well-known industrial bellwether with diversified operations, notice how its share price oscillated around the $15 level throughout much of 2010-2012. Investors tracking the stock surely noticed the gently sloping uptrend at hand during this time; however, for some this price momentum might not have been convincing enough to warrant entering into a long position. In this case, the stock’s historical P/B ratio may come in handy. Notice how GE’s P/B ratio bottomed out around 1.25 in late 2011, after which the stock proceeded to embark on a much steeper uptrend [see How Does General Electric Make Money?].
Honeywell {% dividend HON %}

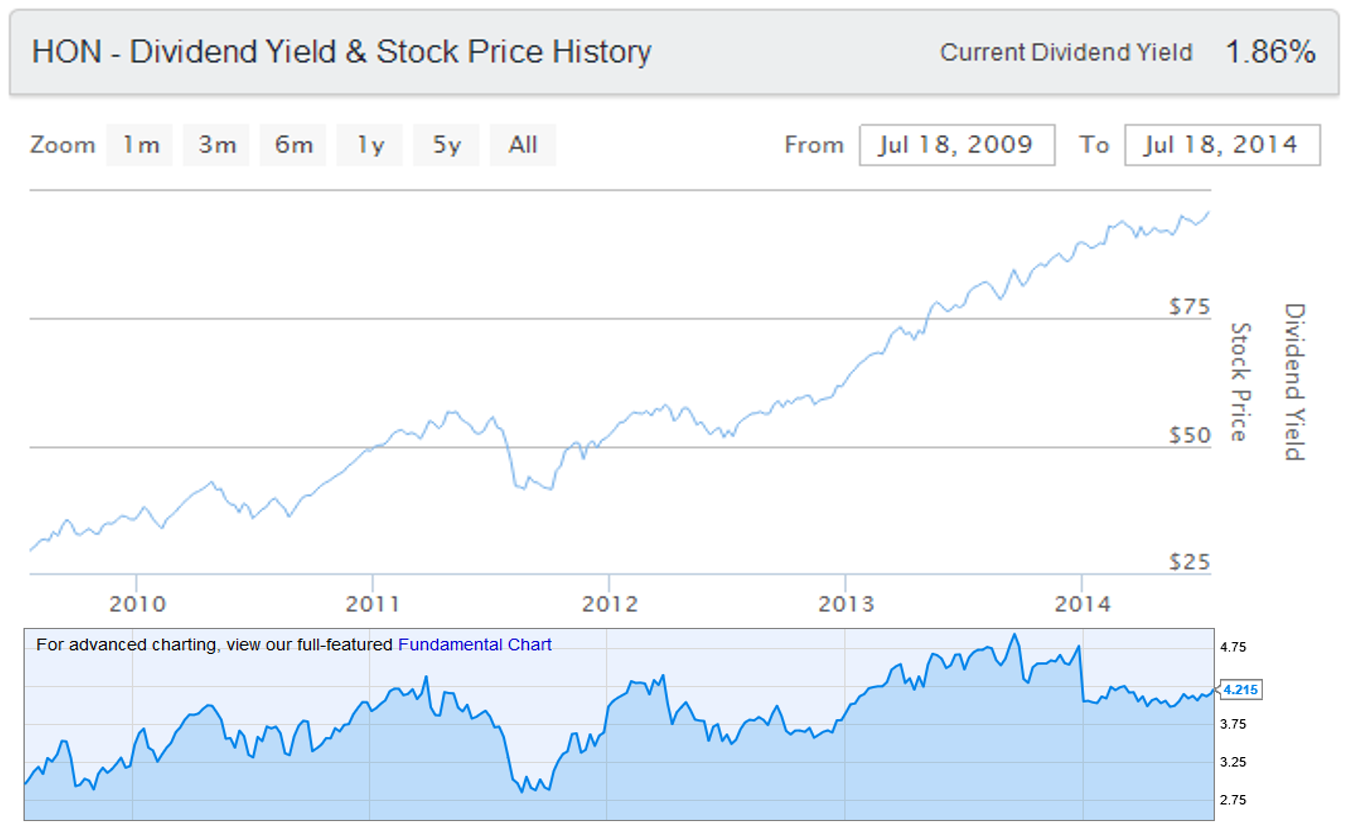
Suppose you were tracking shares of HON since the second half of 2009 and the stock’s steep decline in mid-2011 made you worried that perhaps the uptrend at hand might reverse. In this instance, the stock’s historical P/B ratio could have served as confirmation as to whether or not the underlying fundamentals had changed. Despite the decline in mid-2011, notice how HON’s P/B ratio still held above 2.75, which is roughly equal to the level that it had dropped to, and rebounded off, in late 2009. Shares of Honeywell continued higher heading into 2012 and beyond, and in retrospect, the P/B ratio bottoming out in this period could have served as further evidence that the company was in fact relatively undervalued at the time.
Johnson & Johnson {% dividend jnj %}

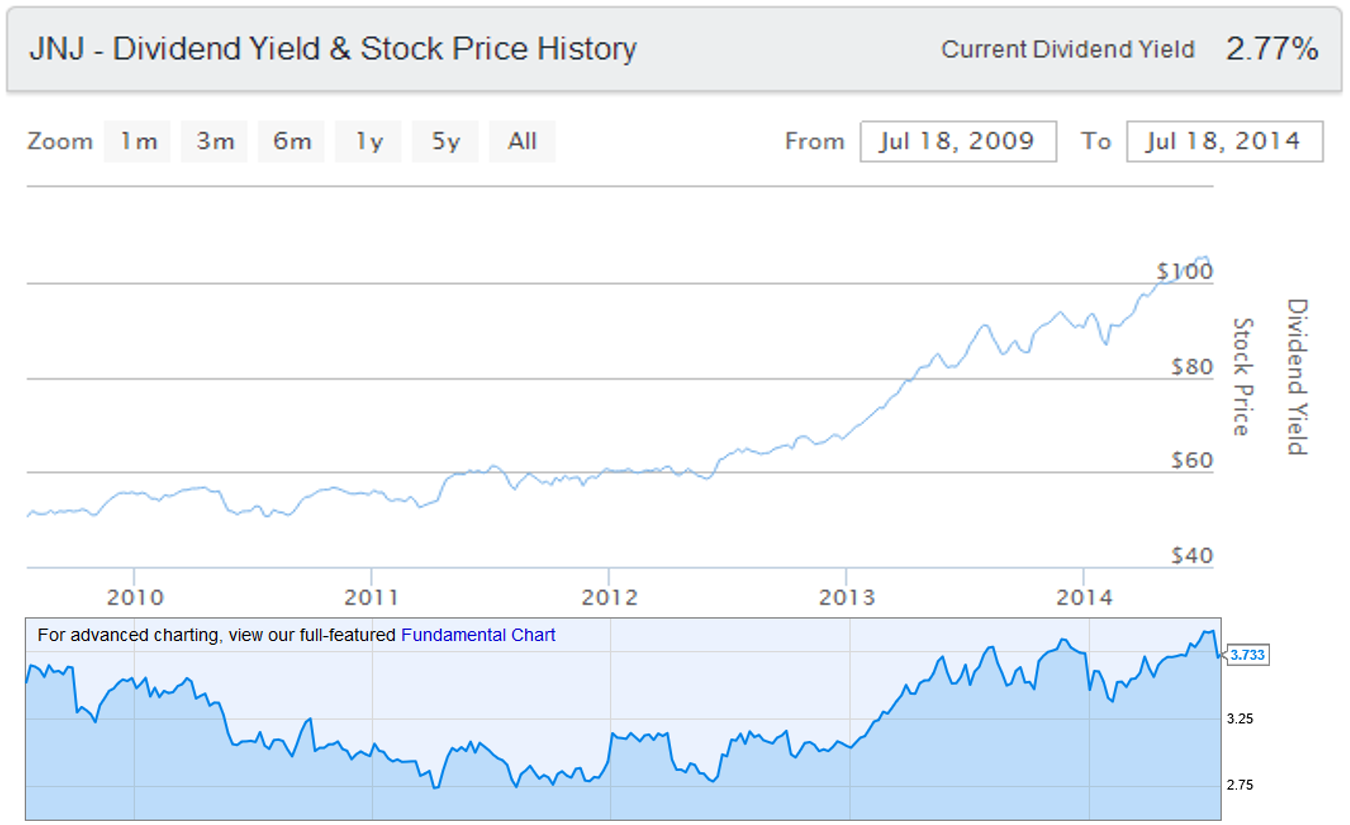
In the case of JNJ, notice how its P/B ratio carved out a bottom at 2.75, after sinking to, and rebounding off, this same level on a number of occasions between 2011 and early 2012. The fact that its P/B ratio failed to sink to new lows after repeated attempts could have served as an indication that shares were relatively undervalued, and were likely not going to get any “cheaper.” This in turn may have given confidence to investors who had been waiting for confirmation that the stock was “cheap enough,” so to say; after the P/B ratio’s last decline towards 2.75 in early 2012, shares of JNJ took off and haven’t looked back since [see also 7 Big-Name Dividend Stocks: An International Sales Overview].
The Bottom Line
Tracking a stock’s historical price-to-book ratio is no easy task, but it does offer worthwhile insights for long-term investors in many instances. The P/B ratio can at times serve as a useful gauge in determining whether a stock is over or undervalued relative to its own trading history. However, as with any indicator, the P/B ratio is far from perfect and therefore investors should not utilize it in isolation when making buy or sell decisions.


