This quarter has been the worst quarter in over a decade.
The S&P 500 Index officially crossed into a bear market on 3/12/20, which is defined as a period in which an index falls 20% from a new high. This marks the sixth time in the last 40 years that the S&P 500 crossed into bear market territory.
Economists are left arguing what letter of the alphabet type of bounce back the market will see from here. A “V” shaped return would be a quick rebound from the bottom, a “U” shaped return would be a slower recovery, a “W” shaped return would be a volatile path to recovery, and the daunted “L” shaped would be flat lining out at the bottom for a long period of time. The only bear market in that time period to see closer to an “L” shaped return, which I will classify as the S&P 500 Index staying in bear market territory for at least 1 year from the start of the bear market, was the 2008/2009 Financial Crisis (Data from Factset).
The mitigation efforts to contain the spread of COVID-19 has rendered the global economy to a standstill, particularly in retail, travel, and leisure. Because of the fluid nature of containment of the virus, it makes it difficult to quantify the impact that COVID-19 will have on the economy, and thus, the stock market.
This is in contrast with the Financial Crisis in that the damage had already occurred, and it was a matter of economists tallying up the impact in its entirety. Entering into the Financial Crisis, the economy was on looser footing. Unemployment claims rose year over year in 2007, whereas, they dropped year over year in 2019. In the four quarters prior to the market entering bear market territory, the average year over year Gross Domestic Product (GDP) grew 2.3%, whereas, it only grew on average 1.6% heading into the financial crisis bear market (Data from Factset).
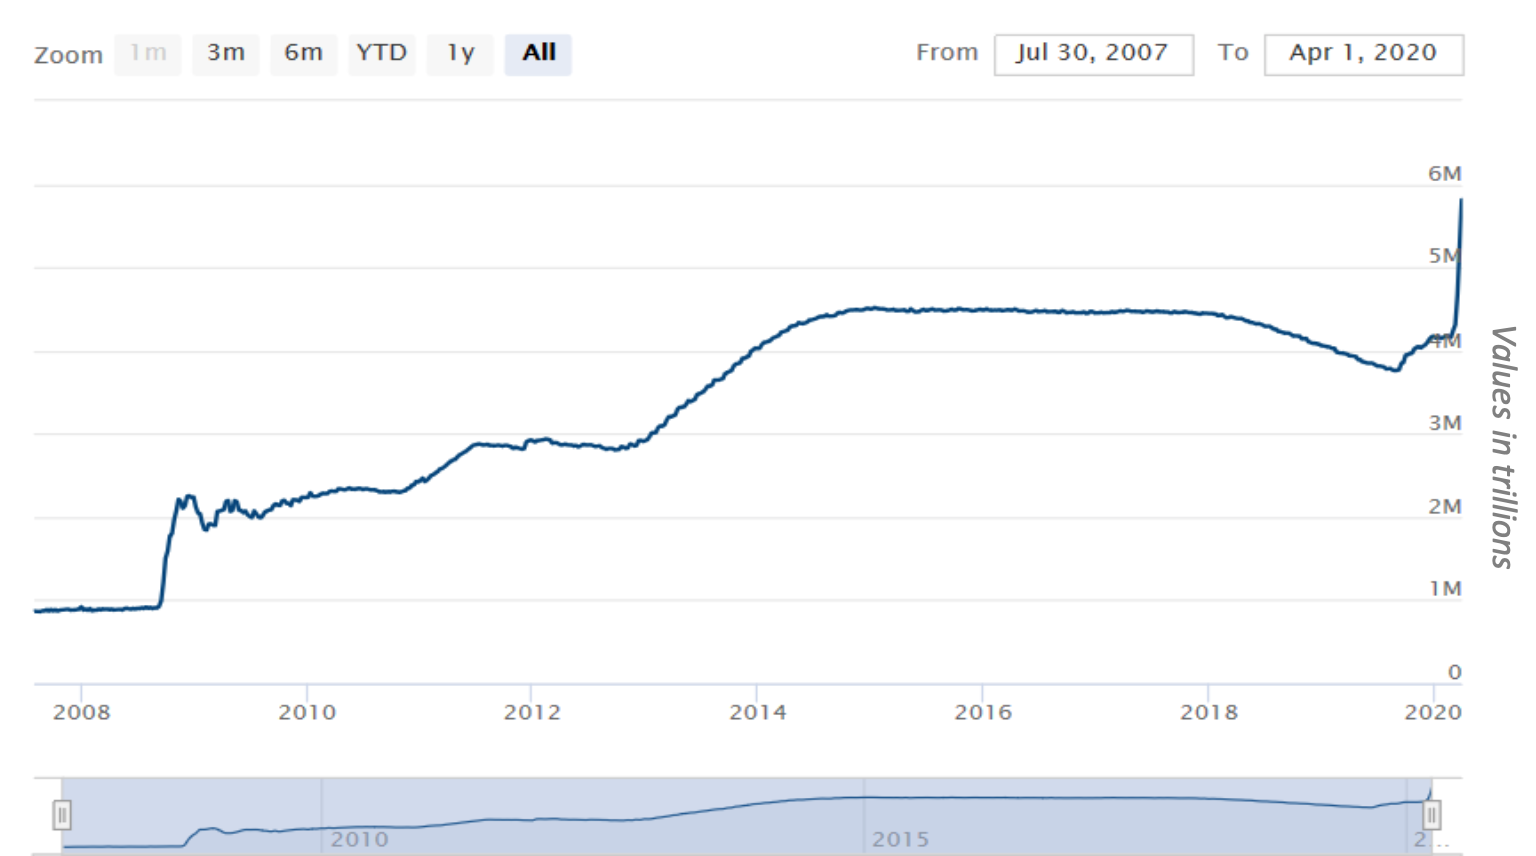
In the moment of a bear market, it’s difficult to see what is going to remedy the markets, however, there’s normally a combination of circumstances that arise to get the market, and eventually the economy, back on track. In this current bear market and resulting economic recession, we see all of those actions being taken. In this case, it is being done at unprecedented levels. According to the federal reserve’s website, since March 2nd through March 31st, the Federal Reserve has increased its balance sheet by nearly $1.6 trillion. This was used to infuse the financial markets with liquidity as the markets were facing unprecedented volatility, and thus, a lack of supporting volume. Below is a snapshot of the movements of the Federal Reserve’s balance sheet since 7/30/07 just to illustrate the drastic measures taken in such little time:

As you can see, measures like these haven’t been taken since the financial crisis. According to Yahoo Finance, as of 04/09/20, the federal reserve also announced a plan to inject an additional $2.3 trillion to provide further liquidity to local businesses and governments. This is in addition to the $2 trillion CARES act that President Trump signed into law on 3/27/20 to provide financial aid to those unemployed and also business loans to small businesses. This totals to nearly $6 trillion worth of relief between the federal government and the federal reserve to provide liquidity and resources to those in economic need as the U.S. economy has been put into a medically induced comma while the medical emergency passes.
Global Beta believes that investments made in bio-technology over the past 1-2 decades positions the world well to find a solution to either contain the impact of the virus or to eliminate it all together sooner than later. In terms of consumer behavior coming out of this, we suspect this will vary by demographic. According to Caitlin Rivers of Johns Hopkins University, as of 04/07/20, the mortality rate, as measured from the deaths in Italy, for those up to the age of 29 was 0.05% and those up to from 30-39 years of age was 0.2%, which is slightly higher than the U.S. mortality rate of the 2019-2020 flu season of 0.11%, according to the Centers for Disease Control (CDC). Therefore, we believe it is more likely that we see millennials (those born between 1981 and 1996) and Gen Z-ers (those born between 1997 and 2012) participate more in the economy, particularly in retail, than those in the older generation part of the population.
Global Beta believes investors need to be prudent about where they invest, and that is why being targeted in your investments, as opposed to investing in a broad-based index such as the S&P 500, is paramount. Global Beta believes optimal factor exposure is critical and now is as good of an entry point as an investor will get.
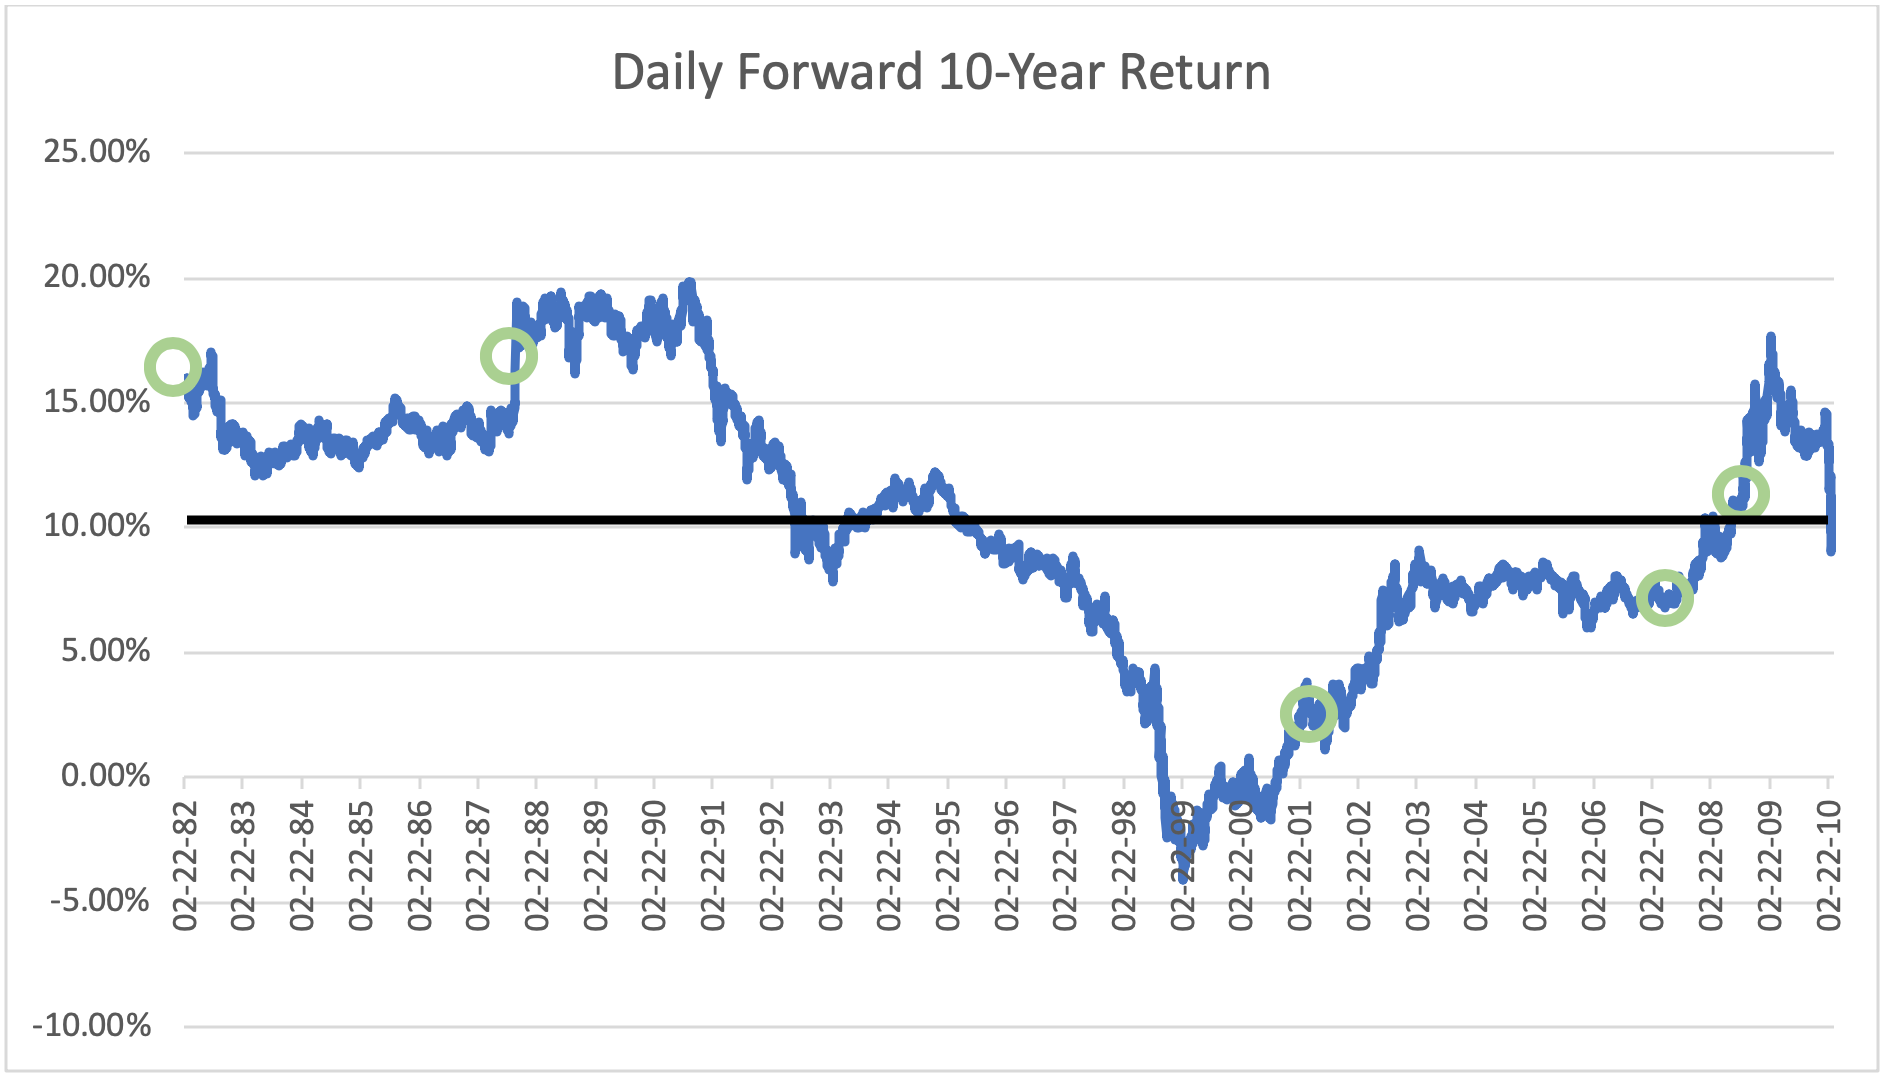
Below is a chart of the rolling 10-year forward returns of the S&P 500 since 2/22/82. That was the date of the early 1980 recession. We have circled the points in time where the S&P 500 reached bear market territories. The black line that runs through the chart is the average 10-year forward return of the S&P 500, which is 10.19%. This is to say, if an investor were to randomly buy the index at any daily point in time, their average 10-year return was 10.19%. When you compare that to the average 10-year return if you had invested right as the S&P 500 crossed into bear market territory in the last 5 bear markets, which was 11.02%; you come out with nearly a 100-basis point annualized advantage.

While this past quarter is one to forget, Global Beta believes the silver lining is that the market has now offered an attractive entry point that hasn’t been seen in over a decade.
Justin Lowry is the Chief Investment Officer for Global Beta Advisors, in Philadelphia, PA.


