Dividend.com is the leading independent source for information on dividend stocks and securities. Resources available on the site include a proprietary ratings system, stock screener, ex-dividend date search, and much more. Below, we walk you through our site and how you can get the most out of the information available at your fingertips.
Best Dividend Stocks & DARs Rating System
Most of the dividend stocks that we cover on Dividend.com are rated under our Dividend Advantage Rating System. This system rates stocks using the following criteria:
- Relative Strength
- Overall Yield Attractiveness
- Dividend Reliability
- Dividend Uptrend
- Earnings Growth
Based on those five factors, stocks can fall into a number of recommendation levels:
| Rating | Recommendation |
|---|---|
| 3.75 to 5 | Highly Recommended |
| 3.5 to 3.7 | Recommended |
| 2.5 to 3.4 | Neutral |
| 0.0 to 2.4 | Avoid for Now |
Ex-Dividend Date Search
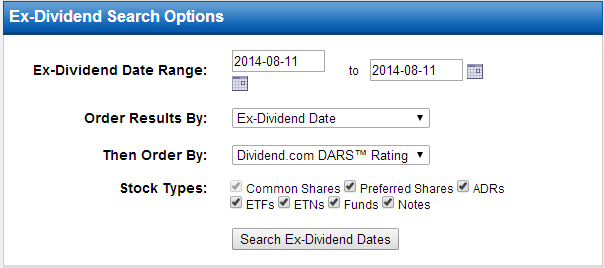
Our ex-dividend date search tool allows users to find stocks by selecting a specific date or date range for ex-dividend dates. The search will automatically include common shares of all stocks going ex-dividend during the selected time period. Users also have the option of adding preferred shares, ADRs, ETFs, ETNs, funds and notes. When the list is generated, the option to export the data to a spreadsheet is also available.
You must own a stock before the ex-dividend date to get the dividend. For more information on ex-dividends, click here.
Stock Screener
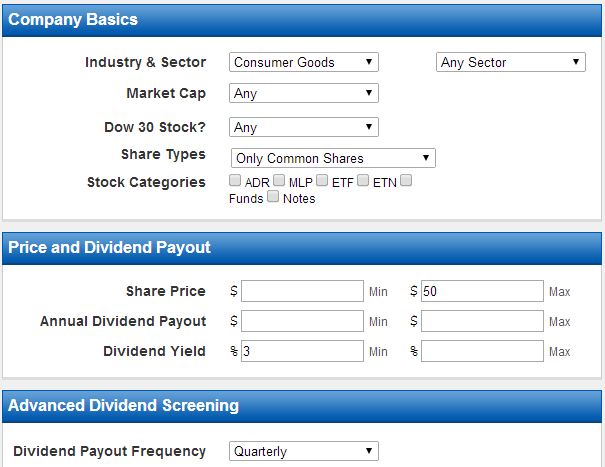
The Screener allows subscribers to search for stocks based on a specific criteria. For example, an investor searching for quarterly paying dividend stocks in the Consumer Goods industry that is under $50 with at least a 3.00% yield would enter the following into the Screener.
Search result example
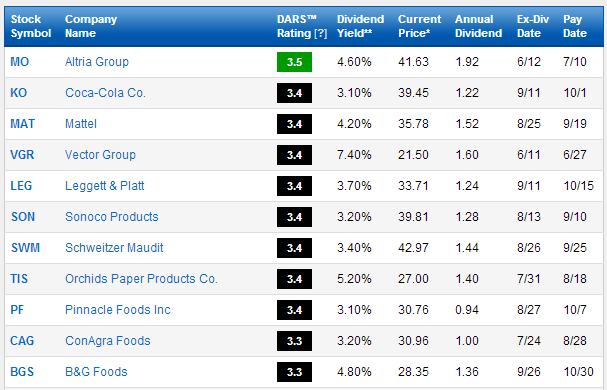
This is a sample of what would appear in the Screener had you input the above criteria:
Dividend Advisor
The Dividend Advisor is included with the Premium subscription and is published in a PDF format in the beginning of every month. This newsletter features a robust lineup of commentary on the industry as well as important information for investors to keep an eye on in the coming month. The Dividend Advisor is your one-stop shop in insights on the value investing world that will help keep you a step ahead of the markets.
It can be found by clicking on Premium. Pictured to the right is a sample table of contents from a past Dividend Advisor to give you a better idea for what you receive each month.
Watchlist
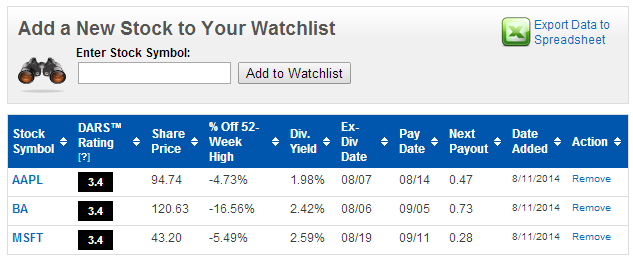
The Watchlist feature allows subscribers to enter an unlimited amount of dividend paying securities that will be promptly added to their personal Watchlist. This allows you to better track and keep up with stocks that you own are would like to keep an eye on. Subscribers will have the option of receiving email alerts for the stocks on their Watchlist. To adjust these settings click here.
Dividend Ticker Pages
There is a ticker page for each stock that we cover on the site. Ticker pages can be found by entering in a company in the Search for Companies or Symbols search box at the top of the page. The ticker pages begins with the basic dividend information about the stock: price, yield, annualized dividend, payout ratio, dividend growth and the Dividend Shot Clock (days until the next ex-dividend date).
Dividend Growth: The dividend growth is based on regular quarterly(or other frequency) dividend increases. For example, Wal-Mart (WMT ) has raised its quarterly dividend at least once a year for more than 30 consecutive years. Further down the page, you will see another growth chart. This chart may differ for some stocks as this is based on annualized growth.

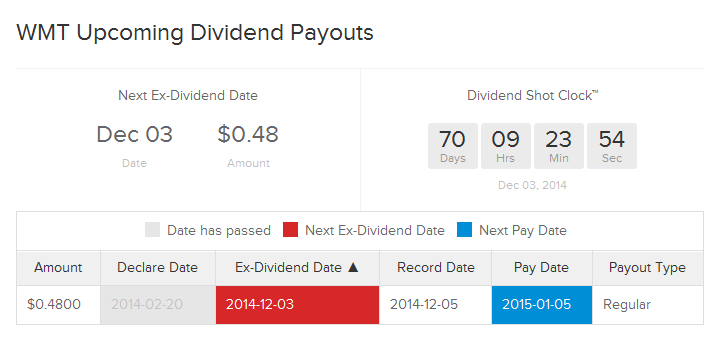
If the stock has an upcoming dividend, the box below will show up on the ticker page. If the ex-dividend date has not yet passed, it will be highlighted in red. The pay date will be highlighted in blue.
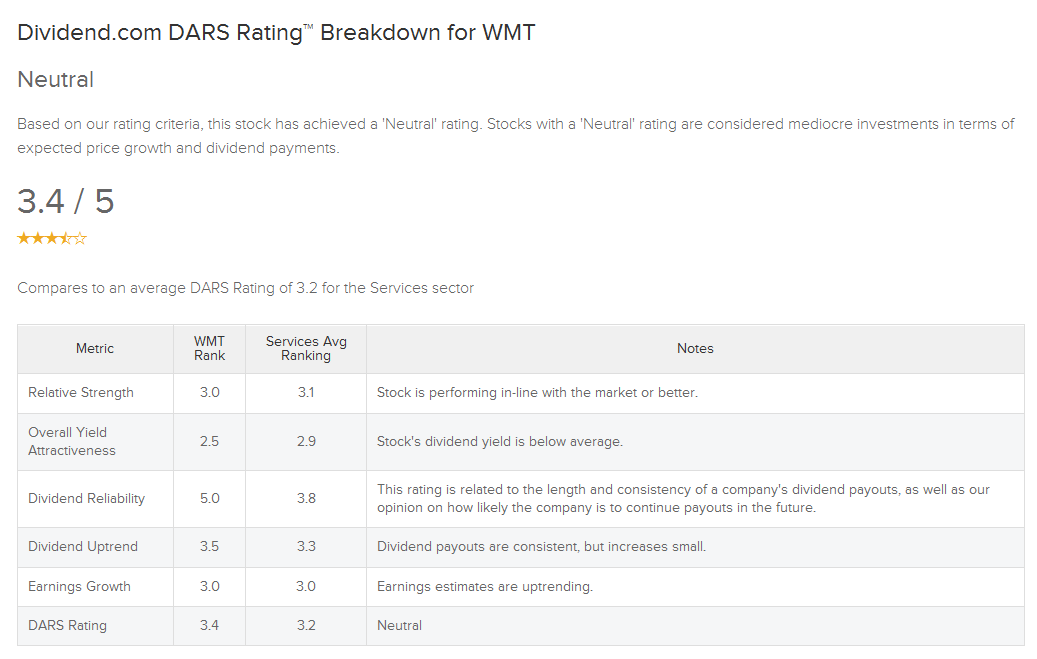
Premium members will enjoy a DARS Rating breakdown for each individual stock, giving you full access and insight onto how the stock was rated and why it received its particular score.
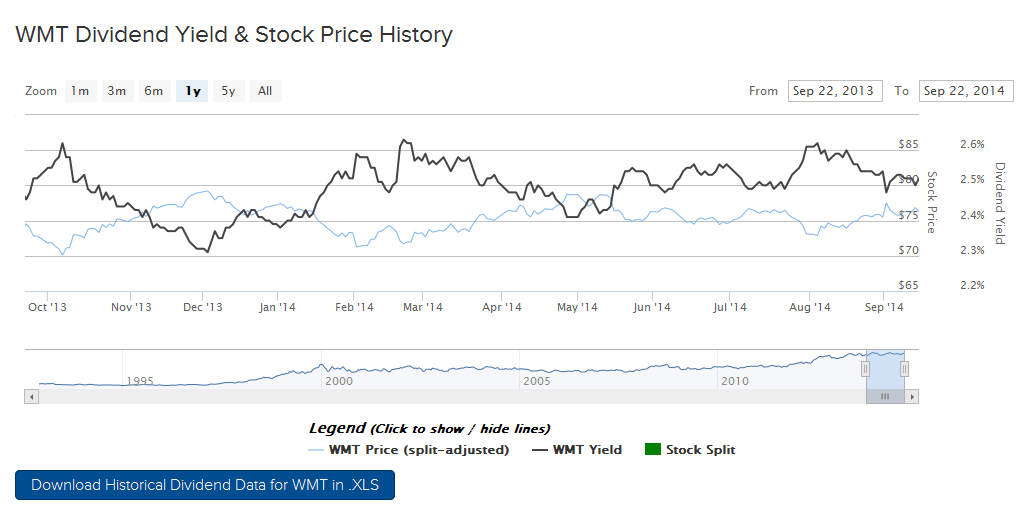
Want to check on a stock’s historical yield? Check out the Dividend Yield & Stock Price History graph. This interactive graph allows you to view the historical stock price (blue line) and yield (black line) for past dates to give you a better idea for how the stock has behaved over time.
Historical Dividend Data
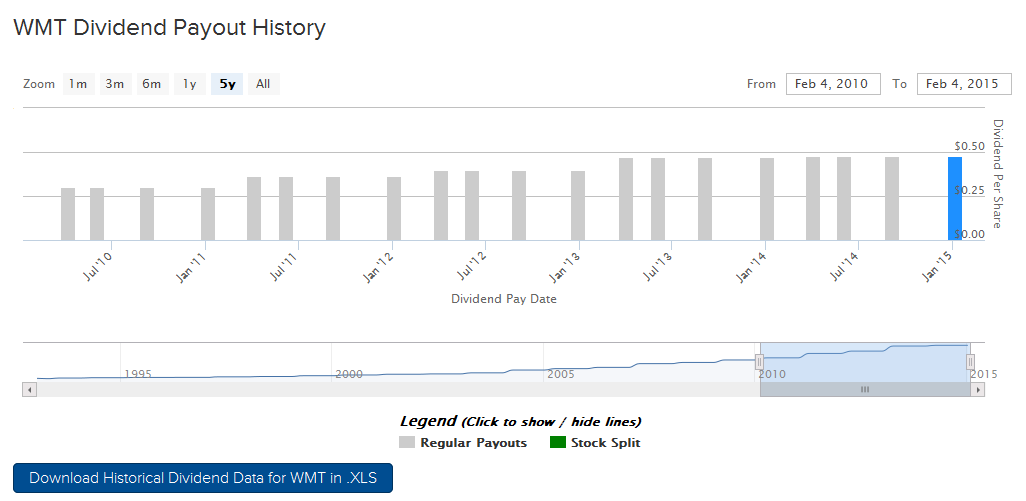
Historical dividend data is available in several formats on the ticker pages. The first format is the Dividend Payout History chart. This chart marks each payout that the company has made during a specific time period. By hovering your mouse over the chart, you will be able to see more information on the payouts. This chart will also mark when stocks made special dividend payouts as well as when then stock has split, if at all.
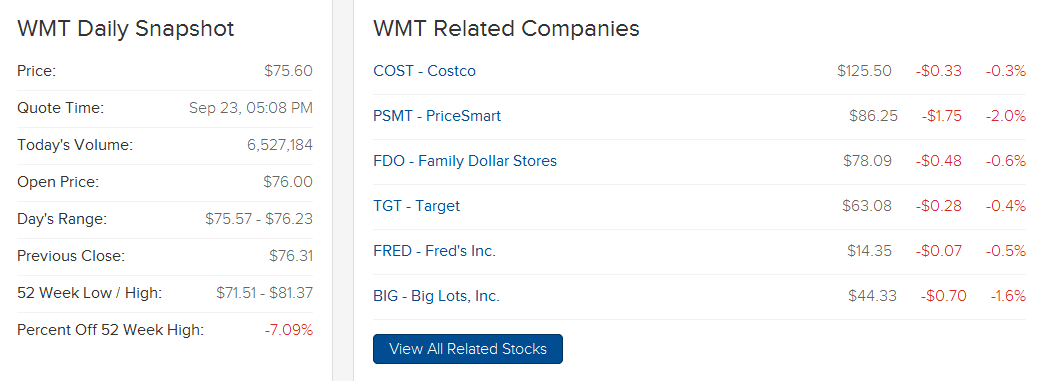
Ticker pages also include a daily snapshot of the stock’s performance metrics for that day. Next to that, investors will be given a list of related companies to allow you to more easily get a feel for the industry and a particular firm’s competitors.
The Annual Dividend Data & Growth chart displays the total dollar amount of dividends paid in a given year. These amounts may differ from the quarterly increases mentioned above.
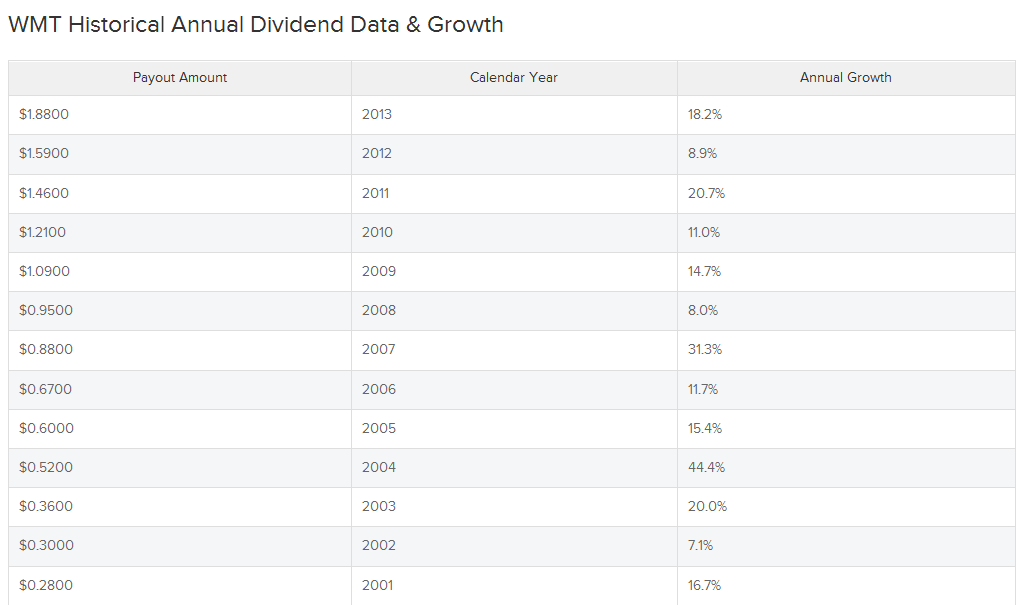
The Annual Dividend Data & Growth chart displays the total dollar amount of dividends paid in a given year. These amounts may differ from the quarterly increases mentioned above.

The ticker pages also include a profile on each individual company that includes links to the firms website, investor relations, Wiki page, and SEC filings.
Other Tools
- Monthly Income Generator - This tool is used by investors who are seeking dividend income during different times of the year. The stocks used in this generator are picks from our Best Dividend Stocks list.
- Compounding Returns - For investors holding on to a dividend stock long term, the Compounding Returns Calculator is a tool that allows them to better prepare for the future.
- Dividend Payout Changes - This tool shows all of the dividend payout changes that occurred each day.
- Upgrades & Downgrades - Everyday, we re-evaluated the stocks that we rate under our DARS rating system. This section shows subscribers what our recent changes were.
- Dividend Stock Guide & Special Reports - Every year, we publish a Dividend Stock Guide that is available in a e-book format. We also have several other reports that are available for download.
- Investing Ideas - Need some ideas for investments? Be sure to check out our research articles.
Most of these features are for Premium members only. For instant access to the entire site, be sure to take our 14 Day Free Trial. If you have any questions, feel free to contact us.


