Introducing a new powerhouse to our Best Sector Dividend Stocks model portfolio – a standout within the large-cap Home/Office Products arena. This firm boasts an impressive 13-year track record of dividend increases, securing it a spot in the top 10% of dividend stocks.
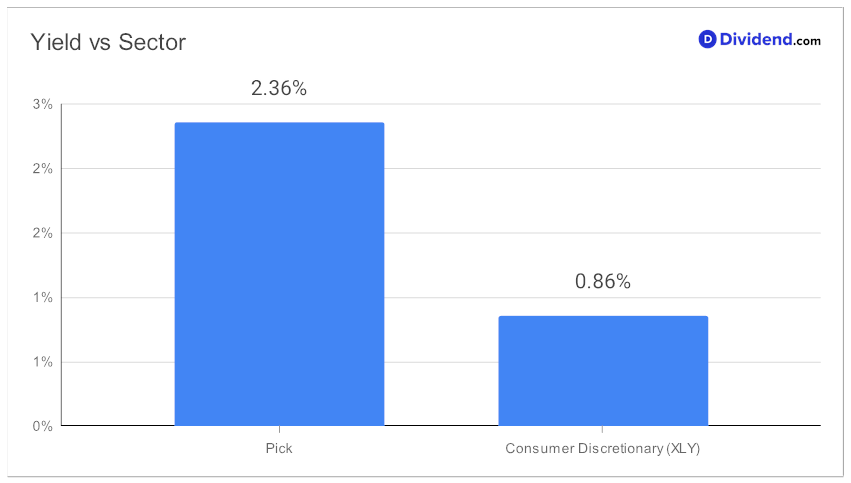
Furthermore, with a future dividend growth promise, it’s set to keep shining. A reassuringly sustainable 34% payout ratio matches industry norms, while its 13% three-year dividend per share compound annual growth rate positions it comfortably in the top 40% of all dividend stocks. And despite having a low yield of 2.36%, it surpasses the average yield of the consumer discretionary sector.
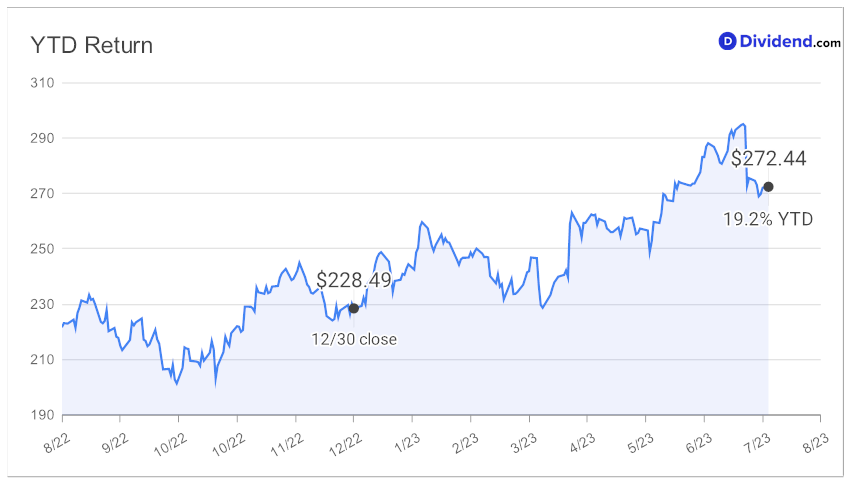
Year-to-date, the company’s returns stand strong at 19%, demonstrating resilience against the broader market.
And, guess what? It’s just about time for their next payout! Estimated at a handsome $1.620/share, it’s expected to be declared around August 4th.
While forming our recommendation, we’ve also factored in key growth drivers and financial performance discussed by the company’s management during its Q2 earnings call held on July 21, 2023.
This is a blend of yield, safety, and returns potential, distilled into a solid investment opportunity.
Want more details? Dive into our comprehensive stock analysis that follows.
Introduction
High dividend investors looking to diversify their portfolio should consider Snap-on Incorporated (SNA), recently added to our Best Sector Dividend Stocks model portfolio.
Synonymous with professional-grade tools and equipment, Snap-on’s robust Q2 2023 financial performance underscores its investment potential. Our recommendation is based on an optimization for a balanced blend of yield, dividend safety, returns potential, and risk within the Consumer Discretionary dividend stocks. This article takes a deep dive into Snap-on’s financial performance, growth drivers, and market sentiment, as well as analyses its dividend profile, returns potential and risk, justifying our ‘hold’ recommendation. Be sure to read through to understand the basis for our stock analysis.
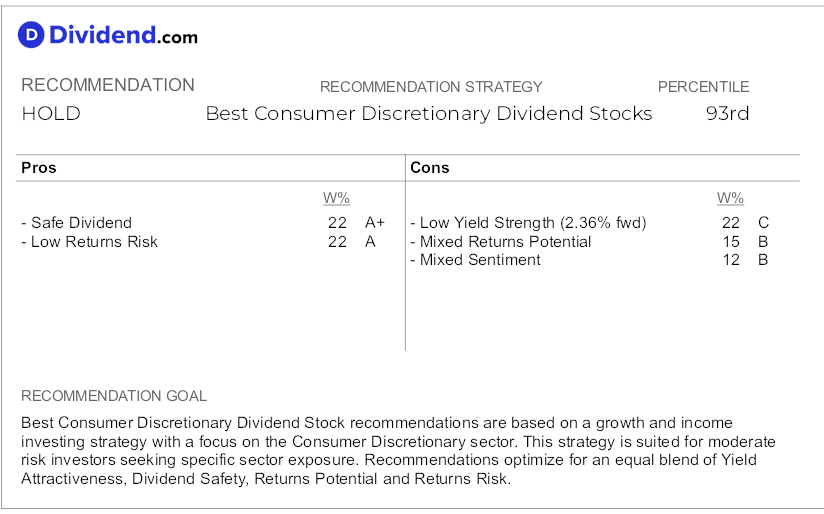
The table below summarizes the overall factors and corresponding weights used in our recommendation:
Company Profile
Description
Snap-on Incorporated, established in 1920 and based in Kenosha, Wisconsin, is a global manufacturer and marketer of tools, equipment, diagnostics, and repair information and systems solutions. The company operates through four segments: Commercial & Industrial Group, Snap-on Tools Group, Repair Systems & Information Group, and Financial Services. The firm offers a wide range of products, from hand and power tools to tool storage products, diagnostic software solutions, vehicle service equipment, and more. These offerings cater to diverse industries like aviation, agriculture, infrastructure construction, government and military, mining, power generation, and technical education.
A key aspect of Snap-on’s business model involves the distribution of hand tools through franchisee-operated mobile vans. These franchisees extend credit to technicians who purchase tools and bear significant operational risk. The company’s Financial Services segment supports this model by providing financing programs for its products and franchisees, offering loans and leases for mobile vans among other services. This integrated approach ensures smooth operations and supports the sales of its products globally.
Growth Drivers
Snap-on Inc., a leading tools and accessories company, displayed robust growth in its Q2 2023 financial performance, buoyed by several key growth drivers and solid financial performance across multiple segments. CEO Nicholas T. Pinchuk reported a 4.8% rise in sales from 2022, amounting to $1.1913 billion, including the impact of an $8.3 million unfavorable foreign currency translation. Despite this, the company managed to maintain strong organic growth, rising by 5.6% and marking the 12th consecutive quarter of year-over-year growth.
In terms of financial performance, Snap-on’s operating income for the quarter, also known as Operating Company (Opco) income, reached $277 million, a notable 12.3% increase from the previous year. This figure included effects of unfavorable foreign currency translation, and the company achieved an operating margin of 23.3%, up by 160 basis points from the previous year. Snap-on’s financial services operating income also rose to $66.9 million, contributing to an overall consolidated operating margin of 26.8%, up by 130 basis points from the previous year. Earnings per share (EPS) were $4.89, showing a promising 14.5% increase from the last year.
The company’s market outlook was positive, with growth trends identified in the auto repair market including increased miles driven, higher spending on vehicle maintenance, and a rise in technician count and wages. These trends suggest growing demand for sophisticated tools and higher technician capabilities as vehicle maintenance and repairs become more complex. The Commercial & Industrial (C&I) segment demonstrated growth, especially in the aerospace, military, natural resources, and industrial transportation sectors, despite identified weakness in certain international locations due to socio-economic headwinds.
Despite facing currency pressures in certain markets, Snap-on’s Commercial and Industrial Group achieved sales growth of 1.4%, with organic volume up by 3%. Power tools volumes declined due to customers expecting new product releases in the following quarter. The group’s operating income (OI) was $68.1 million, representing a 12.4% increase over the previous year. The Tools Group experienced organic sales growth of 1.1%, with the group’s operating earnings rising by 10.7%, reaching $137.7 million. This surge in earnings was nearly double the pre-pandemic level.
The Repair Systems & Information (RS&I) group reported significant sales of $452 million, marking an 8.4% increase driven by gains in equipment and Original Equipment Manufacturer (OEM) essential programs. The operating income for this group was $110.4 million, up 14.7%, with an operating margin of 24.4%. This strong vehicle repair environment offers significant opportunities for the company. The innovative SOLUS Plus diagnostic platform was a major contributor to RS&I’s success, alongside the robust undercar equipment division, which offers a wide range of SKUs to accommodate specific needs of Electric Vehicle (EV) lifting.
Snap-on also reported robust financial health. The company’s balance sheet at the end of Q2 2023 included approximately $2.4 billion of gross financing receivables, with $2.1 billion from their U.S. operation. The company generated $270.3 million in cash from operating activities, mainly due to lower year-over-year increases in working capital investment and higher net earnings. Looking ahead to 2023, the company expects capital expenditures to approximate $100 million, and the full-year effective income tax rate will be in the range of 23% to 24%.
As part of its future strategy, Snap-on plans to further strengthen customer connections, innovate by developing new profitable products and solutions, and drive Rapid Continuous Improvement (RCI) throughout the enterprise. This strategic focus aims to capitalize on the growing vehicle repair market and the rising demand in critical industries.
Market & Analyst Sentiment
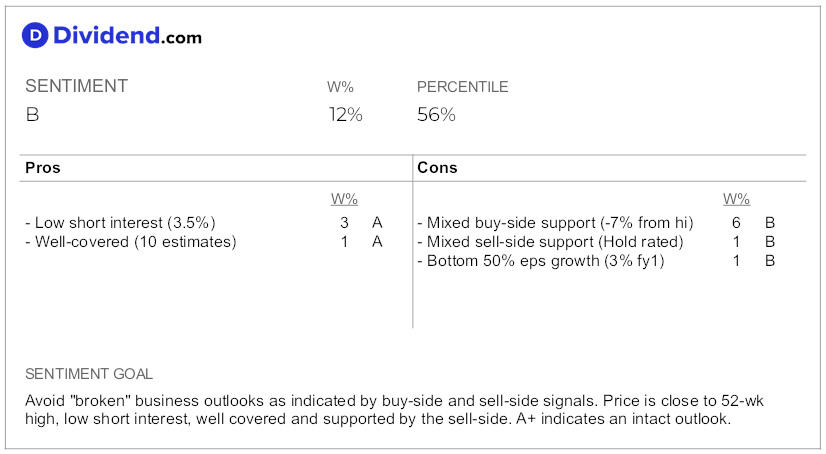
The market sentiment for Snap-on (SNA) is mixed. Analysts have a Hold rating on the stock, indicating a neutral sentiment. They expect the company’s earnings per share (eps) to grow by a modest 3% next year.
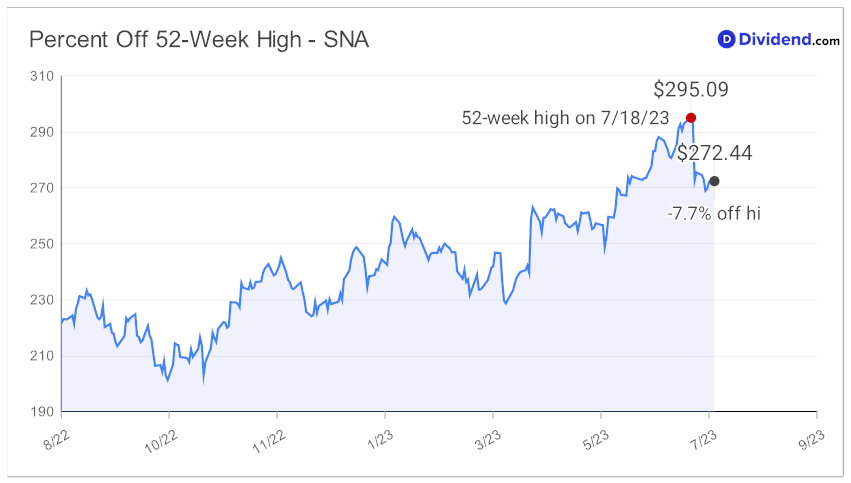
In terms of performance, Snap-on is underperforming the S&P 500, with a -7% return compared to the index’s 0% return over the past 52 weeks. However, when compared to other Home/Office Prods dividend stocks, Snap-on is performing at an average level, as the group has seen a -6% return.
Based on this information, it can be inferred that there is neither strong positive nor negative sentiment towards Snap-on in the market. The stock’s performance is not exceptional compared to the broader market, but it is in line with its industry peers. Investors may want to closely monitor any updates or changes in the company’s financials and market conditions to make informed investment decisions.
Formulas:
- -7% % from 52-wk hi = $275.00 share price / $297.26 52-week high price – 1.
- 3.5% short interest = 1.8M shares short / 51.9M float shares.
- 10 analyst estimates = number of sell-side analysts providing estimates for the stock.
- Hold analyst rating = average rating from 10 sell-side analysts.
- 3% fy1 eps growth = $19.04 fy1 eps / $18.54 fy0 eps – 1.
Dividend Profile
Yield Attractiveness
Yield Attractiveness was graded as a C because the forward dividend yield of 2.36% ranks in the bottom 40% of dividend stocks, indicating a low yield. This suggests that the dividend payout from the company, Snap-on Incorporated (SNA), may not be as attractive compared to other dividend stocks. The Home/Office Prods industry average yield is slightly higher at 2.7%, further highlighting the relatively lower yield of SNA. The annual dividend payout is $6.480 per share, which is paid quarterly. The next estimated quarterly payout is $1.620 per share, expected to be around August 4th.
Dividend Safety
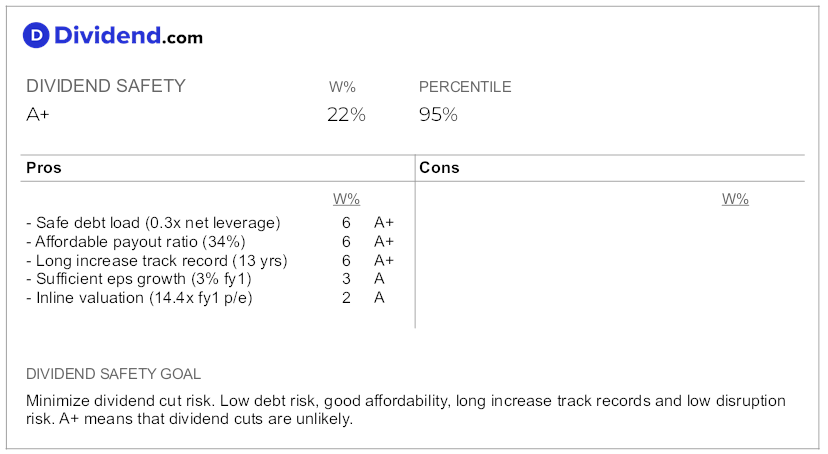
The Dividend Safety grade for SNA is given an A+ because several factors indicate that the company’s dividend is safe and likely to continue increasing in the future.
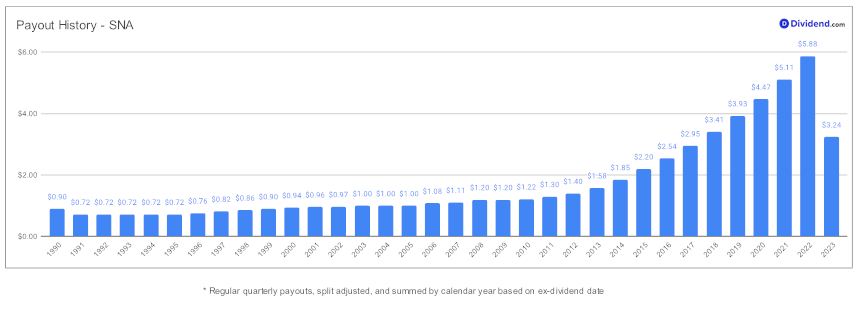
Firstly, SNA has a strong track record of increasing its dividend for the past 13 years. This places it in the top 10% of dividend stocks, indicating a consistent commitment to rewarding shareholders with increasing dividends. The expectation of future dividend increases further supports the safety of the dividend.
Secondly, the company has a low payout ratio of 34%. This means that only 34% of its earnings are being used to pay dividends, leaving a significant portion of earnings available for other purposes such as reinvestment in the business or debt reduction. This low payout ratio suggests that the dividend is sustainable and not at risk of being cut.
Thirdly, SNA has a safe debt load with a net leverage ratio of 0.3×. This indicates that the company has a low level of debt relative to its earnings, reducing the risk of financial strain and the need to cut dividends to meet debt obligations.
Additionally, SNA is expected to have a 3% growth in earnings per share (EPS) next year. This stable growth rate suggests that the company’s profitability is likely to continue, providing a solid foundation for dividend payments.
Lastly, the company’s valuation is inline with the industry average. SNA has a price-to-earnings (P/E) ratio of 14.4x, which is slightly higher but roughly in line with the Home/Office Prods average of 11.3×. This suggests that the market is valuing SNA ’s earnings and dividend potential fairly, further supporting the safety of the dividend.
In summary, the Dividend Safety grade of A+ for SNA is based on its strong track record of dividend increases, low payout ratio, safe debt load, stable earnings growth, and reasonable valuation. These factors indicate that the company’s dividend is safe and likely to continue increasing in the future.
Formulas:
- 2.36% forward yield = $6.48 annualized dps / $275.00 share price.
- 13 yrs of increases = Consecutive years of dividend increases.
- 0.3x leverage = ($1.3B debt – $833.4M cash) / $1.4B ntm ebitda.
- 34% payout ratio = $6.48 annualized dps / $18.83 ntm eps.
- 3% fy1 eps growth = $19.04 fy1 eps / $18.54 fy0 eps – 1.
- 14.4x p/e = $275.00 share price / $19.04 fy1 eps.
Returns Profile
Returns Potential
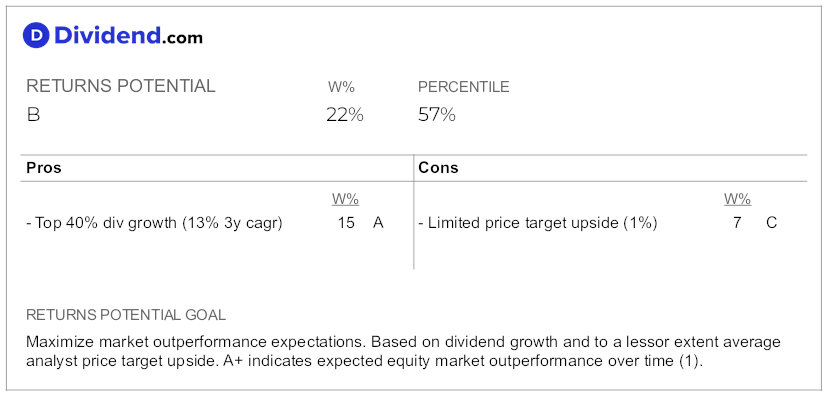
The Returns Potential grade for SNA was given a B because it has a mixed performance in terms of dividend growth and price target upside.
In terms of dividend growth, SNA has a 13% 3-year dividend compound annual growth rate (CAGR), which ranks in the top 40% of all dividend stocks. This indicates that the company has been consistently increasing its dividend payments to shareholders over the past three years. This is a positive factor for investors who are seeking income from their investments.
However, the price target upside for SNA is limited to 1%. This means that sell-side analysts believe that the stock has already reached its fair value and does not have much room for further price appreciation. This suggests that the stock may not provide significant capital gains for investors.
Overall, the mixed performance in terms of dividend growth and price target upside led to the B grade for Returns Potential. While SNA has a strong dividend growth track record, the limited price target upside indicates that the stock may not offer substantial returns in terms of capital appreciation.
Formulas:
- 13% 3y dividend CAGR = (CY0 dps / CY-3 dps)^(1/3) – 1.
- 1% price-target upside = $278.17 average price target / $275.00 share price – 1.
Returns Risk
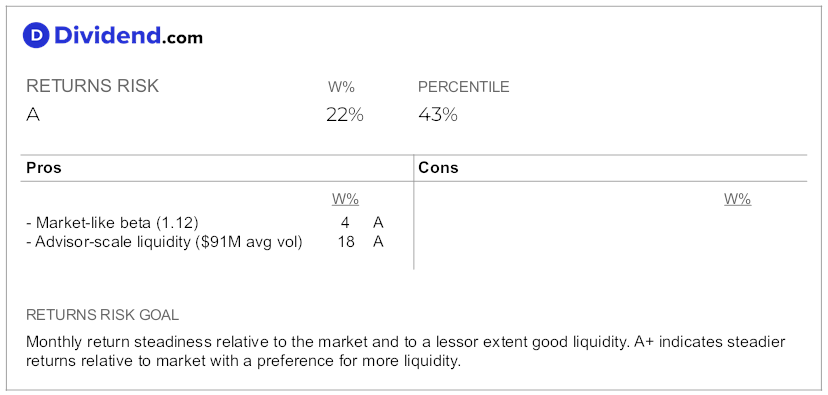
The Returns Risk grade for SNA is given as an A, indicating that the returns risk associated with this stock is low. This assessment is based on two key factors: the market-like beta of 1.12 and the significant liquidity of the stock.
The beta of 1.12 suggests that the monthly returns of SNA are similar in direction and magnitude to the overall equity markets. A beta of 1 indicates that the stock’s price tends to move in line with the market, while a beta greater than 1 suggests that the stock is more volatile than the market. In this case, the beta of 1.12 indicates that SNA ‘s price movements are slightly more volatile than the overall market, but still relatively stable. This lower volatility implies a lower level of risk associated with the stock’s returns.
Additionally, the significant liquidity of SNA is another factor contributing to the low returns risk grade. The average 10-day dollar trading volume for SNA is $91 million, which is considered to be in the top 30% of most liquid stocks. Liquidity refers to the ease with which a stock can be bought or sold without significantly impacting its price. Higher liquidity generally indicates a lower level of risk, as investors can easily enter or exit positions without facing significant price fluctuations. In the case of SNA, the significant liquidity suggests that the stock can be traded with ease, reducing the risk associated with returns.
In summary, the Returns Risk grade of A for SNA is based on the market-like beta of 1.12, indicating relatively stable price movements, and the significant liquidity of the stock, allowing for easy trading without significant price impact. These factors contribute to the assessment that the returns risk associated with SNA is low.
Formulas:
- 1.12 beta = correlation of monthly price changes over the last 5 years.
- $91M daily liquidity = 332.8K daily shares traded on average over the last 10 days * $275.00 share price.
Quant Recommendation
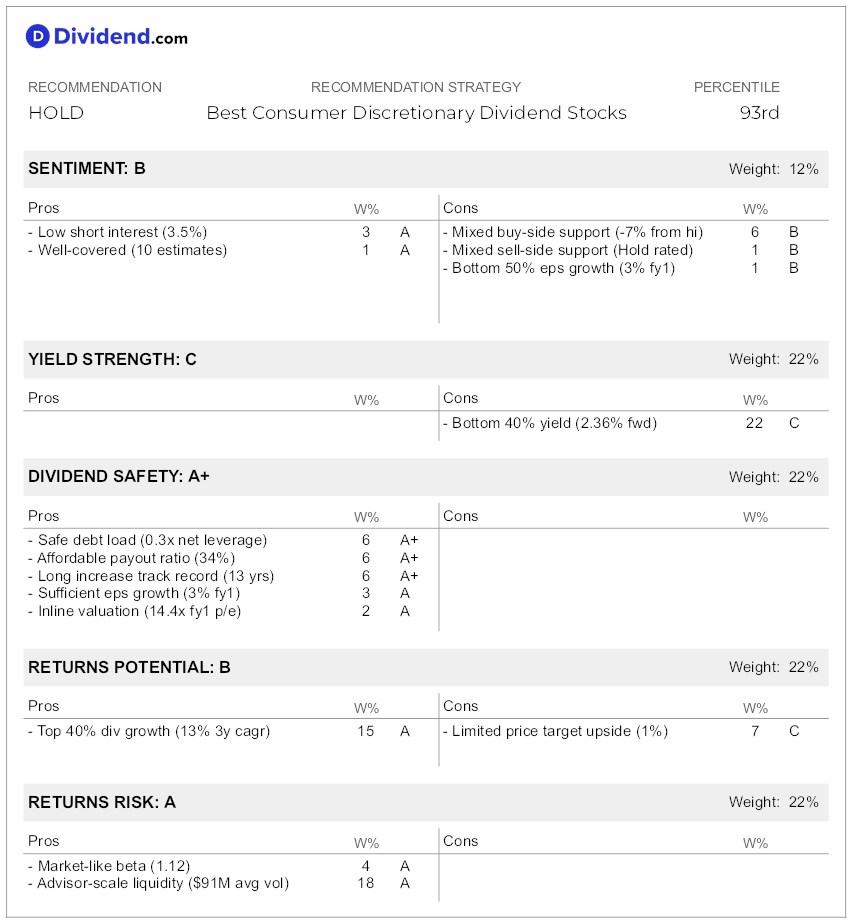
The recommendation for Snap-on (SNA) is to hold the stock. This recommendation is based on optimizing for an equal blend of yield, dividend safety, returns potential, and risk among Consumer Discretionary dividend stocks only. Despite having a safe dividend and low returns risk, SNA ’s best consumer discretionary dividend rank has been reduced to the 93rd percentile due to an unattractive 2.36% yield, mixed sentiment, and mixed returns potential. There are 85 stocks in the consumer discretionary sector that offer a better blend of best dividend factors, and only the top 10% receive Buy recommendations.
The table below shows the detailed factors and corresponding weights used in our recommendation:
Conclusion
In conclusion, Snap-on Incorporated (SNA) has been added to our Best Sector Dividend Stocks model portfolio due to its compelling blend of yield, dividend safety, returns potential, and risk.
While the yield may not be as high as some alternatives, Snap-on’s solid financial performance, consistent dividend growth, and robust business model make it a noteworthy addition to any high dividend investor’s portfolio. Its position in the 93rd percentile of the Consumer Discretionary dividend stocks underscores the value it presents for discerning investors. However, as with any investment, we advise ongoing monitoring of the stock and its market conditions for optimal returns.
Are you looking for quality dividend ideas in the Consumer Discretionary sector? Follow the holdings in our Best Consumer Discretionary Dividend Stocks model portfolio, which we review each week.
Other Changes to the Portfolio
In order to make room for SNA, we had to remove Magna International (MGA) at a significant profit as its ranking in our rating system dropped.
Disclosure
The author nor anyone on our investment team personally owns the stock mentioned in this investment analysis. This analysis and its results are based solely on the research provided by Dividend.com.


