
Looking at the entire ETF market across asset classes as of May 2021, active ETFs total $200 billion, representing just 3.3% of the current $6.1 trillion total. However, we believe the active ETF share of the market has an opportunity to grow due to both regulatory and strategy-demand driven tailwinds. In addition to recent updates to SEC policies around exemptive relief further streamlining the listing process, active ETFs can provide flexibility that can be hard to find in passive funds1.
An active ETF is simply an ETF that does not track an index. The structure occupies the middle ground between the traditional active mutual fund and a passive ETF. Unlike most passive ETFs, active ETFs can either disclose their holdings daily, or can institute a more opaque disclosure regime (referred to as a semi-transparent ETF). A relatively recent development, semi-transparent structures are not required to fully disclose their holdings, and rely on several different strategies to facilitate efficient trading. Some research suggests that uncertainty about future holdings may decrease liquidity for active ETFs, and a lack of complete transparency certainly does not improve this2.
However, it is too early to tell what level of adoption the semi-transparent structure will ultimately have.
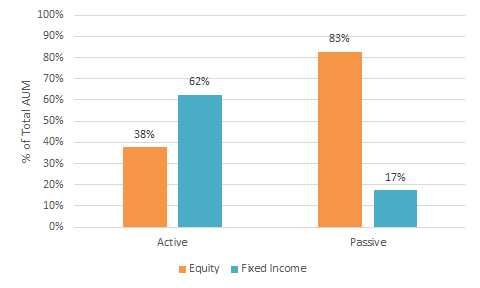
Looking under the hood in Chart 1, the asset class coverage is quite different between passive and active ETFs, with fixed income occupying a much larger share within the active ETF space. One reason for this could be the over-the-counter nature of both bond issuance and transactions, which leads to a preference for non-index based implementation for fixed income-focused ETFs. A second reason could be a lack of demand on the equity side, due to exceptional performance of the market-cap heavy equity index trackers. Within the active fixed income space, First Trust is the leading issuer with over $31.5 billion, more than $10 billion ahead of their nearest competitors JP Morgan and Pimco.
These trends may be changing, as seen in Chart 2. There has been a recent boom in launches within the equity space over the last few years. Over 75% of the equity-focused active ETFs available today were launched since 2019, and these funds have also gathered $28 billion of the $74 billion total invested in these products.
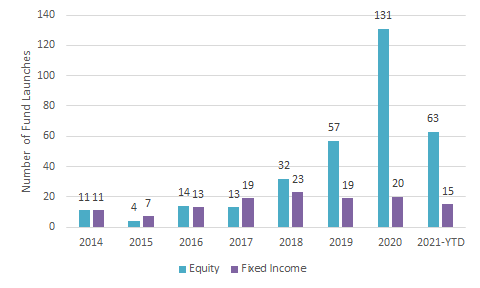
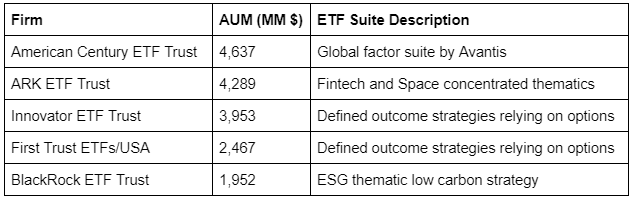
Table 1 shows the top issuing firms by today’s AUM within the equity space, along with a brief description of their strategies launched since 2019. There are three broad categories that emerge: factors, options, and thematics. As both users of and advisers to active ETF strategies, Horizon believes the active ETF structures are a better fit for these themes.
Factor Strategies
Factor strategies are most well known in the ETF space as Smart Beta strategies. These strategies use a systematic approach to select and overweight stocks with specific characteristics. Some examples include momentum investing, low volatility, quality, and value. Some research suggests these exposures may outperform for various behavioral or economic reasons. An active ETF may allow for greater innovation through proprietary advancements in measuring these characteristics over time. This is harder to achieve in a passive fund, and a resource intensive undertaking. Additionally, having flexibility around ETF rebalances may help reduce trading costs and increase factor exposures, particularly in times of elevated volatility. In the passive ETF space, over 60% of the AUM in these strategies rebalances strictly quarterly, while 33% adjust their portfolios only every six months to a year3.
Option Strategies
Within the defined outcome strategies made popular by First Trust and Innovator, many of these strategies utilize FLEX options (exchange traded options that are customizable to specific use cases and terms). Since these options are created on an as needed basis with tailored features, indexing is for the most part incompatible. Within the broader use of more mainstream options, craftsmanship choices for practical implementation can also be critical for managing risk in an options strategy compared to a more rigid index-based setup.
Thematic Strategies
Speaking generally, thematic strategies can involve either a highly customized process, such is the case for ARK’s strategies, or by definition, are highly concentrated into a particular theme or group of stocks. Issuers here may also want to protect their proprietary investment processes by avoiding having to publish their specific rules, which is required for a passive strategy. Due to elevated levels of portfolio concentration, these strategies may also benefit from more flexibility around investing or redeeming assets, making the active ETF structure a preferable choice.
Conclusion
Recent market dynamics have promoted a surge in active ETF issuance within the equity space. We expect continued demand for factors, options, and thematic strategies, which may be more conducive to the flexibility provided for in the active ETF structure. Additionally, regulatory factors have also made it less burdensome to list active ETFs. Given the combination of regulatory tailwinds and growing demand for novel, actively managed strategies, we expect the recent trends of the underdog active ETF to pick up from here.
© Horizon Investments, LLC, 2021.
1https://www.sec.gov/news/press-release/2020-150
2https://www.sciencedirect.com/science/article/abs/pii/S1044028320302726?dgcid=rss_sd_all
3Source: Calculations by Horizon Investments using rebalance frequency Bloomberg data for passive equity ETFs.
Mike Dickson is the Head of Portfolio Management at Horizon Investments.


