
Ford (F ) is where it all began.
The auto industry came into existence after Henry Ford started the company more than 100 years ago. Now more than 200,000 people work for the company and the new CEO is trying to get the company ready for the future.
Ford by the Numbers
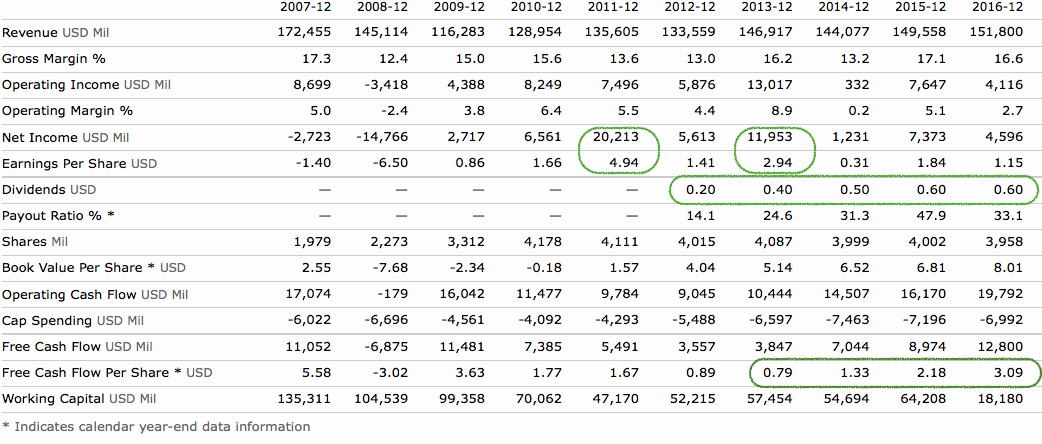
Ford Motor Company has been able to grow revenues almost consistently from 2009, recording a 30% growth from $116 billion in 2009 to $151 billion in 2016. This, however, has not translated into a consistent increase in operating or net income (despite maintaining a gross margin of 13% to 17%). As a consequence, the company’s earnings per share (EPS) has also been inconsistent: $2.94 in 2013 to $0.31 in 2014 to back up to $1.84 in 2015 and then down again to $1.15. So, it’s not surprising that the market has punished the stock, which is now in its fourth straight year of decline.
In terms of regions, the company did well (in terms of pre-tax profit as per 2016 annual results) in North America, Europe and Asia Pacific, but lost ground in South America and the Middle East & Africa. Ford also gained momentum in its financial service segment of 2016, which is turning out to be a significant contributor and hugely profitable for them.
The company also has a high financial leverage ratio of 8.16 and debt-to-equity ratio of 3.2. Auto companies are known to carry higher leverage ratios, but Ford is operating at greater risk compared to its peer group on a long-term basis. For instance, Daimler (FRA:DAI) had a financial leverage and debt-to-equity ratio of 4.19 and 1.17, respectively, as of the end of 2016. Those two ratios for General Motors (GM ) stood at 5.06 and 1.27, for Nissan (OTCMKTS:NSANY) 3.79 and 0.95, and for Honda (HMC ) 2.60 and 0.55 during the same period.
Auto Industry in Transition
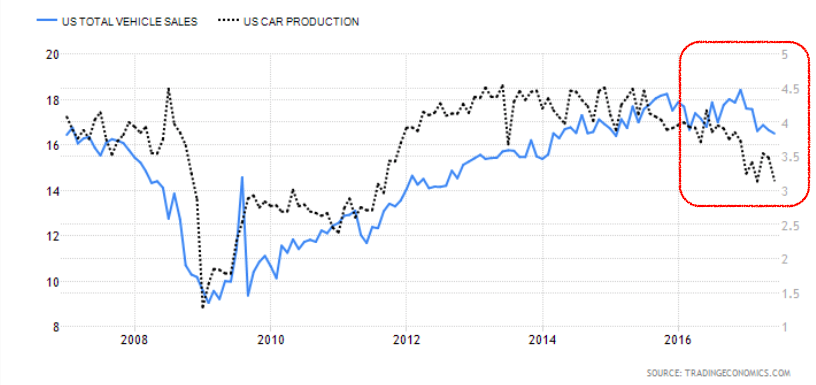
The U.S. auto industry has been in a declining mode since the end of 2015, in terms of sales and production.
There have been several explanations behind this trend. Baby boomers who are now 60+ are cutting down expenses, and Millennials prefer to “rent” and “uber” more than owning homes and cars. Some analysts blame the glut in the used car market for the decline of new car sales. A few months back, Toyota (TM ) concluded as well that U.S. car sales have peaked. As we move into the self-driven and electric car era, this period of transition is likely to hurt traditional automakers, but the stable price of oil and growing demand in other countries is likely to smoothen the ride. Ford is also preparing well for this transition into the next era of cars by making investments in the technology of the future, such as its planned five-year investment in autonomous vehicle startup, Argo AI.
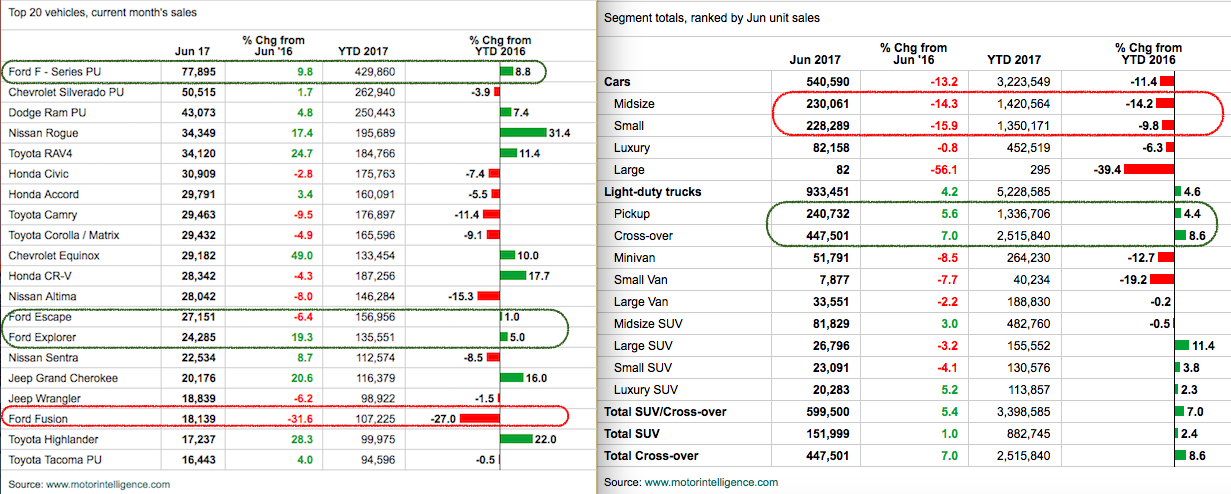
As compared to 2016, year-to-date unit sales of midsize and small cars are down by 9-14%. On the other hand, pickup trucks and crossovers have shown some improvements of 4-8%. The bright side for Ford in this market decline is the fact that four Ford vehicles feature in the top 20 most sold vehicles in the US (June 2017) and three of the four cars have seen an uptick in the year-to-date sales as compared to 2016. The company’s 2017 guidance remained unchanged in their Q1 investor presentation declared earlier this year. They expect their pre-tax profit to dip in 2017 to approximately $9 billion (from 10.4 billion in 2016) but then recover in 2018.
Be sure to read why we believe Ford is stuck in neutral.
Ford as an Investment
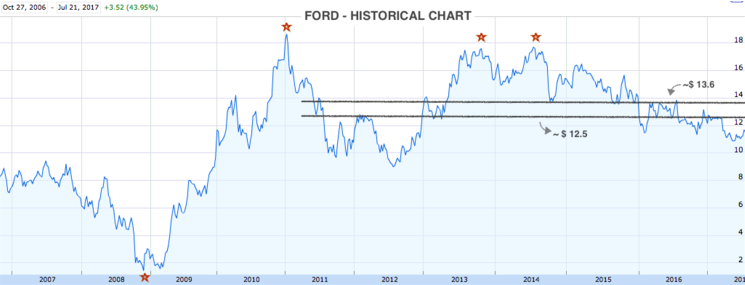
It was in early 1999 when Ford Motor Company reached its all-time high of almost $37. During the financial crisis, the company was close to shutting down, and the stock price went below what it costs for a coffee at Starbucks ($1.43 to be precise). Since then, its story has been quite remarkable and the stock breached $18 in a little over two years. That will be the price to beat in the coming years, but more immediate support and resistance levels to look out for would be $13.6 and $12.5. The stock has been on a gradual downward trend since mid-2014, losing 35% of its value. Take a look at the complete history of Ford for details on income, price and dividends.
Despite the downward trend, Ford Motor Company’s P/E ratio is higher than some of its peers like Volkswagen and GM. This brings up a possibility that the stock might correct a bit more from its current levels. Want to know how Ford stacks up against its competitors? Click here.
The story brightens up on the dividend side as Ford currently provides investors with a high yield of around 5.30%. The company doesn’t pay dividends on a consistent basis (e.g. during years of the financial crisis from 2007 to 2011) but has been paying from the 50s and has been on an upward trend since 2012. In the last three years, there has been a considerable improvement in the free cash flows and the payout ratio is at a comfortable 37%.
The Bottom Line
Ford, like many other automakers, is dealing with a shrinking market. Its current financials are much better than what it was in the peak of the financial crisis, but it’s not as strong as it can be. Ford Motor Company has one of the best dividends you can get from a large company. Investors should wait and watch the stock, and invest only when there is sufficient signal from the immediate support/resistance levels. The current automobile market is in a phase of transition with technology and consumer preferences expected to change at a rapid pace in the coming years (read: oil prices, electric cars, Internet of things, self-driving cars and renting over ownership). It remains to be seen how Ford adapts to these changes and how well its investments pay off.
You can find an updated list of companies that recently announced changes in their payout policies, along with their ex-dividend dates, in our Dividend Payout Changes and Announcements tool. Check out our Best Dividend Stocks page by going Premium for free.


