
Home Depot (HD ) is “just” 39 years old and yet is the biggest home improvement retailer in the world.
Even the stores are fittingly big and average more than 100,000 square feet. The company runs 2,278 “DIY” stores located largely in the United States but also in Mexico and Canada, which account for 13% of Home Depot stores.
The Business of Home Improvement
Home Depot has had a fabulous last few years. While it has grown its revenues 27% ($74.7 billion in 2013 to $94.6 billion in 2016), operating expenses have stayed reasonably flat, recording only a 4% increase. As a result, the company has been able to increase its net income by more than 75% ($4.5 billion to $7.9 billion) and its diluted earnings-per-share by more than 100% ($3 to $6.45) in the same period. No wonder the stock has returned more than 100% in the last four years (not counting dividends), far beyond S&P 500 and Dow Jones.
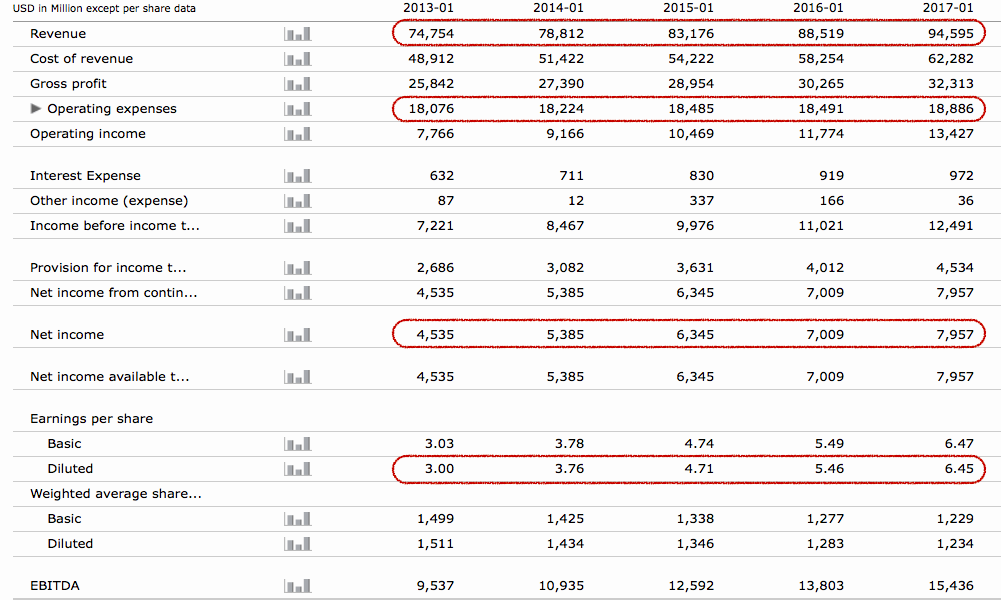
What has been particularly encouraging is that the increased revenue has come from not just an increased number of transactions but also increased ticket size per transaction and increased sales per square foot. Comparable store sales have increased by a healthy margin as well.
The Future
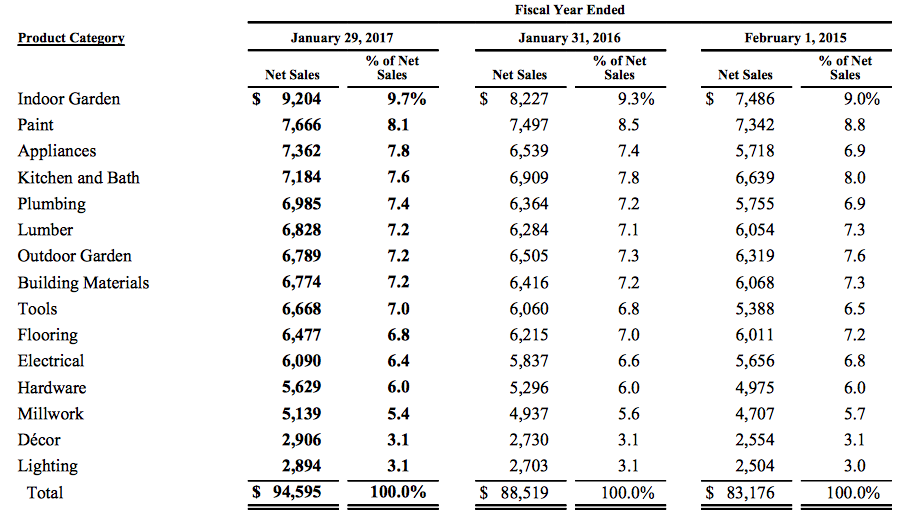
The pattern of exceptional performance of the last few years is repeated in product categories as well. Not a single category declined in sales in the last year. That is quite remarkable for a company that expects to cross $100 billion in sales in 2017. The indoor garden category is the company’s biggest contributor to sales. In comparison outdoor garden, which typically occupies approximately 20% of the space (24,000 sq. ft of space attached to a 104,000 sq. ft store), contributes about 7.2% of the sales.
However, almost all of these categories are very closely dependent on the U.S. housing market, where the company has 87% of its stores.
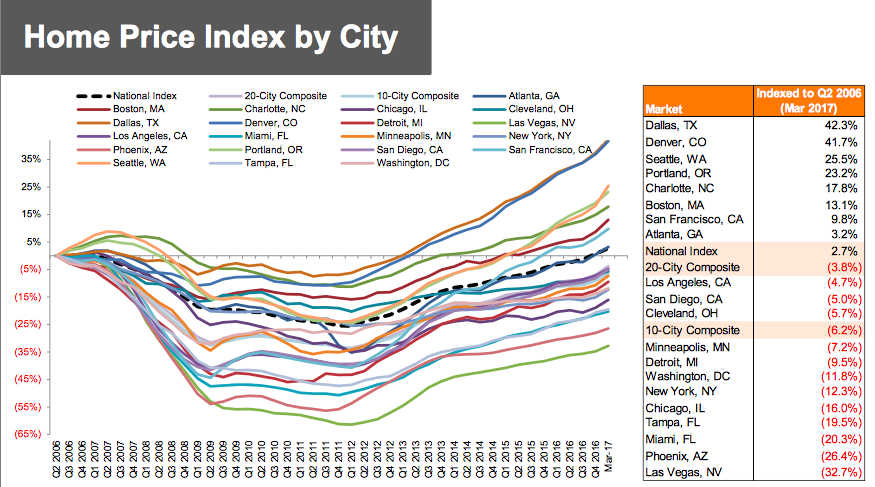
As can be seen from the above illustration, home prices have continued to improve with the national average now 2.7% above the Q2 2006 prices. The company has 100 or more stores in California, Texas, Florida and New York (in decreasing order). Therefore, price improvements in major cities in the above states will affect the company’s bottom line the most.
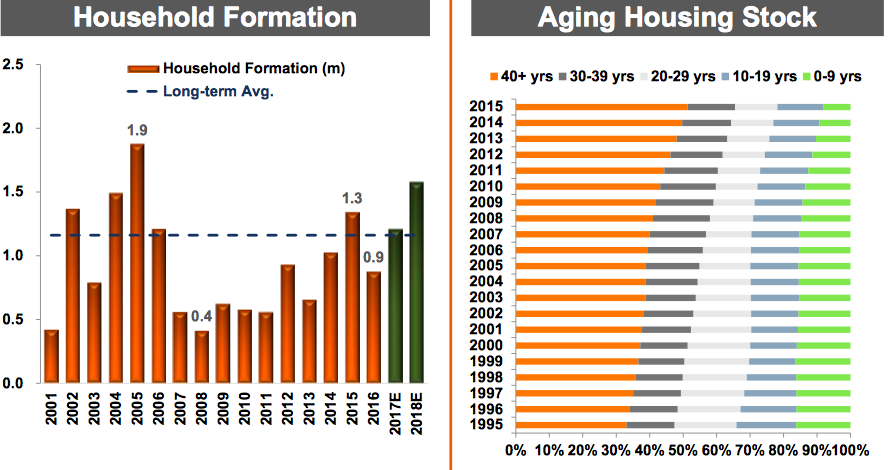
From the above chart, it is evident that household formation is likely to cross the long-term average in 2017 and 2018. At the same time, housing aging on 30+-year-old homes is well above 60% (primary targets for home improvements). These economic indicators are encouraging signs for Home Depot.
However, a potential long-term risk factor that investors need to be aware of is the share of online sales. It took Home Depot six long years from 2010 (where it allowed customers to buy online and return in stores) to facilitate buying online and delivering from stores. The share of online sales continues double-digit growth with $5 billion in sales but only contributed to 5.9% of total sales in 2016.
Home Depot as an Investment
Home Depot stock reached an all-time high last month in June. Since then there has been a minor correction, but the stock is still relatively close to that high point. It has grown more than 7 times compared to where it was after the last financial crisis, rising from approximately $18 in March 2009 to $152 in July 2017. Like a lot of companies, Home Depot has gained more than 25% since the U.S. elections in November last year. It has performed better than the S&P 500, which returned approximately 15% in the same period. Despite the significant gains, Home Depot’s P/E ratio of 22.8 is comparable to that of some of its peers. For instance, the P/E is marginally lower than that of Lowe’s (LOW ), which is the closest comparison.
Home Depot doesn’t qualify to be in the league of dividend aristocrats, but it has been paying dividends for more than 20 years with very few breaks in between. The average annualized dividend growth has been more than 20% in the last four years. The company’s current dividend yield is 2.43%, payout ratio is just under 50% and there has been a steady increase in free cash flow from $5.6 billion in 2013 to $8.1 billion in 2017. These factors make Home Depot a safe choice for investors looking for consistent dividends. The company recently communicated that it expects to continue to raise dividend payouts at a rapid rate in 2017.
Use the Dividend Screener to find high-quality dividend stocks based upon 16 parameters. Click here to learn about the Top 100 dividend-paying stocks in the services sector.
Bottom Line
Home Depot’s recent run in the stock markets is well deserved and correlates perfectly with the rise in earnings per share. The stock is fairly priced, and investors can expect a good dividend payout in the coming years. The company is well placed to make use of the favorable conditions in the U.S. housing market in the next few years.
Stay up to date with next week’s significant corporate changes regarding dividends in our News section on Dividend.com.
Check out our Best Dividend Stocks page by going Premium for free.


