
Chevron (CVX ) is one of the biggest oil companies in the world and is part of the Dow Jones Industrial Average and the S&P 100.
It’s earlier predecessor, Pacific Coast Oil, started operations in the 1870s and falls in the league of "big oil,” which includes the likes of Exxon (XOM ), Shell (RDS-A ) and BP (BP ). Based out of California, the company is involved throughout the supply chain, starting from exploration and production to refining and transportation.
Current Perspective
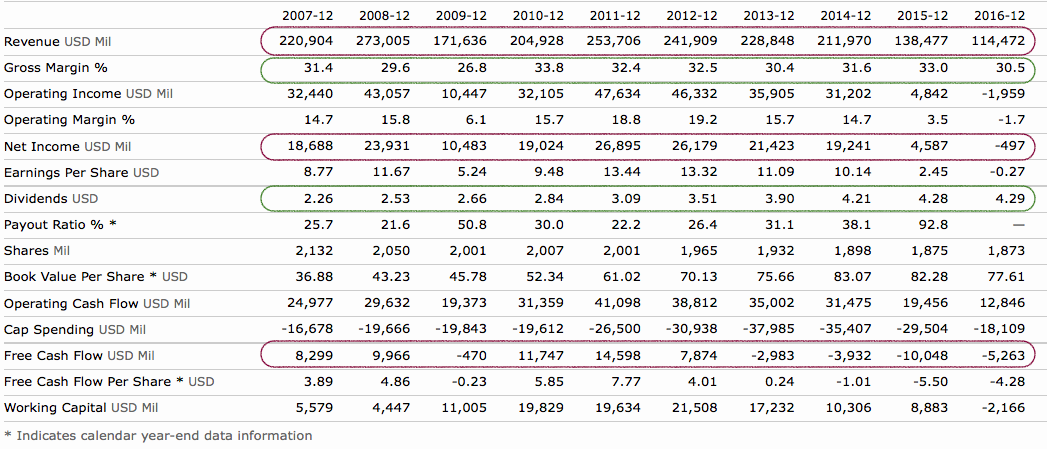
Chevron has struggled to grow or sustain its topline in the last five years. The last two years have been especially tough for the company. There has been a sharp fall in revenues, and as a result, operating and net income have turned negative. Even though the company has continued to grow its dividends, the payout ratio and free cash flow are now a cause of concern for investors with future dividend expectations.
Over-supply issues from 2014 have reduced the price of crude oil, and that has had a significant impact on the company’s corporate results and stock market performance.
Like other oil companies, Chevron has responded with cuts to expenses, employee headcount, refocusing explorations and selling under-utilized assets. In 2016, the company reduced its capital spending by 34% ($22.4 billion in 2016 compared to $33.9 billion in 2015) and operating expenses by 10%. On similar lines, the company expects capital and exploratory expenditures in 2017 to be further reduced to under $20 billion. It has also sold assets totalling up to 2.8 billion, which is a much-needed cash flow. In 2017, it expects more sales that could support free cash flows and future dividends. The company has focused on short-cycle projects that will start producing cash flows at a much faster rate.
The Future
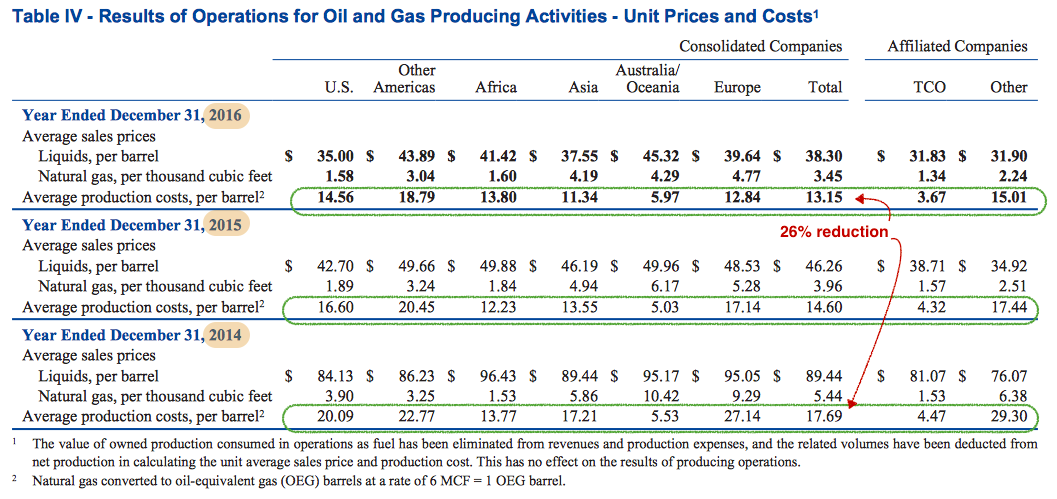
In the last two years, Chevron has worked on increasing efficiencies and reducing redundancies. This has resulted in a reduction of unit cost of production by an impressive 26% as compared to 2014. The cost of production of oil in the U.S. and other Americas is higher compared to Australia/Oceania, and the company is investing heavily in building assets outside of the U.S. Wheatstone LNG projects in Australia is expected to contribute more than 10 percent of Australia’s total future liquefied natural gas production. In addition, investment in the Wellhead Pressure Management Project at the Tengiz Field in Kazakhstan is expected to result in a crude oil production increase of 260,000 barrels per day.
As per U.S. Energy Information Administration, the short-term outlook for natural gas, crude oil and petroleum products presents a minor improvement in prices as compared to the previous years. However, cost reforms and asset sales at Chevron are expected to help the company recover from its current position. This is one of the reasons why Chevron has been a recipient of speculative interest in the stock market, resulting in a disjointed performance in the last 6-8 months.
Chevron as an Investment
Chevron has been growing dividends for more than three decades and currently has a high dividend yield of 4.06%. The dividend growth rate has slowed down recently but is still a healthy 7% in the last five years. The payout ratio is high and close to 100%. The company’s free cash flow (FCF) doesn’t look green either. Last time it had a positive FCF was in 2012 ($8.8 billion). In 2016, it stood at negative $5.2 billion, which is a significant improvement from 2015, when it was negative $9.5 billion. The good thing is that the FCF is scheduled to improve in 2017 because of cost reduction and asset sales’ measures.
Check out the dividend history of Chevron here.
Now that you have explored Chevron’s dividend history, you can also use the Dividend Screener to find high-quality dividend stocks based upon 16 parameters. You can even screen stocks with DARS ratings above a certain threshold.
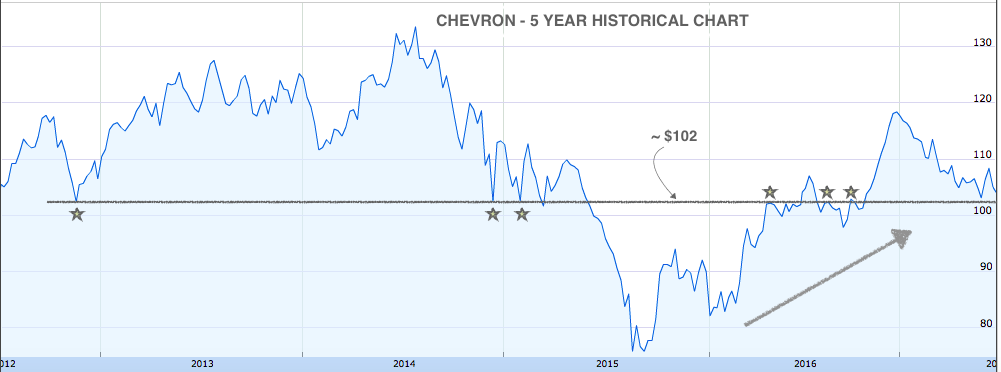
The Chevron stock, in the meantime, has had an unusual last few months. It appreciated 18% from October-end to late December, but corrected most of that in the following months. On a longer time scale, this seems to be part of a continuing upward trend since late 2015, when the stock used to be around $75. An interesting thing to note is that the stock is close to an historical support level of around $102. From a purely technical point of view, investors can expect a sharp movement in either direction if the stock breaches or bounces from that level.
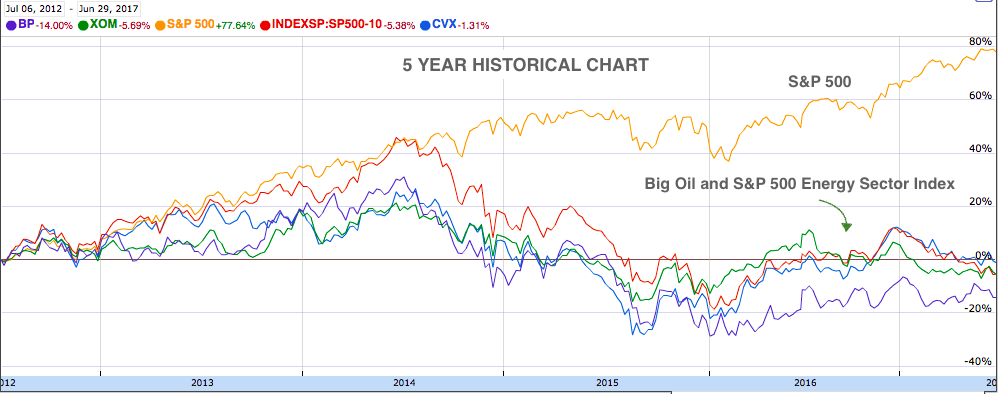
From a valuation perspective, Chevron currently has a P/E that is significantly higher than Exxon, Royal Dutch Shell and Total S.A., and marginally higher than BP. While S&P 500 has appreciated close to 80% in the last five years, supply glut in the energy sector has resulted in big oil stocks returning 0% or worse.
The Bottom Line
Oil prices have risen more than 50% since early 2016, the result of oil companies recovering some of their losses from previous quarters. Chevron earned an adjusted $1.23 per share in the first quarter of 2017, compared to expectations of $0.86 per share.
Chevron displayed good management composure in a high pressure period and made some crucial cost improvements along with timely asset sales. Asset sales will help the company assure dividend payouts in the near future. Investors are advised to monitor the energy outlook closely before making making a decision on energy stocks like Chevron.
Find out all the companies that have increased their dividends for more than 25 consecutive years in our 25-year dividend increasing stocks page, and for more than ten consecutive years in our 10-year dividend increasing stocks page. Check out our Best Dividend Stocks page by going Premium for free.
The views expressed in the article are my own and do not represent views of my clients. Follow me on Twitter @tanmoyroy for more frequent updates.


