
Last week I wrote about a heady topic, that of what ‘retirement’ might actually mean for investors in the 21st century. This week, we’ll tighten the focus on our lens and look at a few narratives permeating the global financial markets.
We’ll focus in on what the movements may foretell us as equity investors. Let’s dive in.
So Far, Bill Gross Has Been Dead Right on Bunds
Back on April 26th, I wrote about how Bill Gross, the co-founder of bond giant PIMCO, now a Portfolio Manager at Janus “Broke the Internet”. Tongue squarely in cheek, I referenced a tweet Gross made from the Janus account noting that, “German 10yr bunds = The short of a lifetime.”
Gross was proclaiming that yields were too low, likely artificially suppressed by the massive QE program the ECB (the EU’s central bank) put in place, and that the yields would bounce back.
Wow, has he been right, he very nearly, perhaps a day or two off, bottom ticked the call. See below.
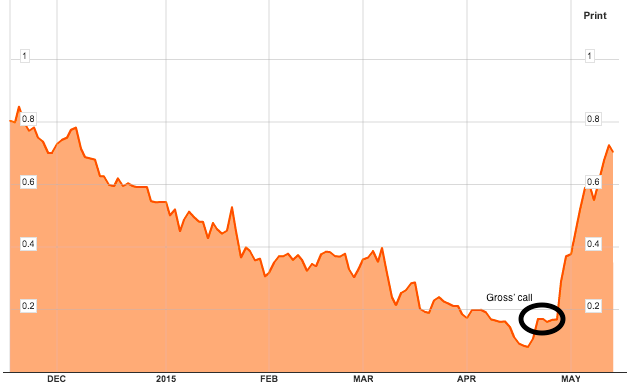
Why Care About Gyrations in the Bund Market?
It’s a good question, and one that is not easily answered. Ultimately it speaks to a thematic we’ve been loud about in our detailing over the past number of years—ever since the Fed embarked on their aggressive QE program (and other central banks followed suit)—these ain’t normal times. Bund yields, as Barron’s so deliciously described it, were in fact “as close to zero as ‘damn it’ is to swearing”. Hat tip to that wordsmithing, but the reality is that the EU’s largest economy having 10-year yields at near zero, can’t be a sign of a super healthy global financial system.
That said, in this supremely interconnected world, any pithy description of why trillion dollar markets gyrate—especially fixed income markets—usually misses seventeen layers of depth to the underlying story. We haven’t even touched on how or if Janet Yellen’s recent comments about the US stock market’s valuation looking “generally quite high” might impact things. The great Fed debate is in full swing as to when the Fed starts to raise.
Let’s look at another chart the market’s are chewing on right now.
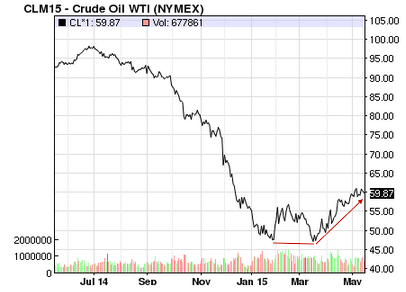
Oil Rebounds
We documented the decline of oil in detail from the time period of fall 2014 through 1Q 2015, however, we haven’t remarked (at least in the Sunday edition of this page) on the bottoming and subsequent strengthening in both WTI (see chart above) and Brent over the past couple months.
Since bottoming near $43, when the bear calls for $20 oil were abundant (how low can YOU go!?), oil has surged back to near or above $60 over the past week or so. Is this a head fake, what happened to the “massive oversupply” narrative that drove the price down precipitously? We wrote a piece titled “The Cure For Low Price”, and were very early I might add, about how ultimately the drop in oil was going to lead to two things: lower supply (E&P companies would curtail drilling activities) and increase demand.
While more definitive and convincing data needs to play out over a longer time, it is likely that the market, a forward looking machine, is at least anticipating at least one or both of these to occur.
Abnormal Is The New Normal
While German bund pricing, nor WTI pricing aren’t likely ever-present thoughts for you, one thought we just can’t seem to shake here at Dividend.com is how no one really knows just how artificial our markets are right now. Given the unprecedented, globally conducted quantitative easing programs that have been running in some form or another for going on seven years now, it’s really hard to determine it.
As Donald Rumsfeld, at the time the US Secretary of Defence noted, this risk falls into the category of “known unknowns”.
Have a great rest of your weekend and speak to you on Monday!


