
Receiving steady dividend income as one of your diversified trading strategies is an excellent way to generate returns over the long term. Unfortunately, choppy market conditions and unwanted volatility can make the entry point of a trade difficult, leaving you initially underwater as you wait for the trade to payout over time. One way to enhance your dividend investments, as well as protect you from adverse market movements, is to employ a covered call overlay.
Covered Calls
A covered call trading strategy is an income-producing strategy where you ‘write’ or sell call options against stocks or ETFs that you already own. Typically, one call contract is equal to 100 shares of an underlying stock. The key to successfully enhancing your dividend strategy with covered calls is to evaluate the options available and determine if they are providing an ample premium – making the covered call strategy attractive. If you sell covered calls, you are giving up some capital appreciation, but if your goal is income then this strategy is a perfect fit for you.
Finding Covered Calls
An option value is based on probability. The price of an option reflects the probability the stock will be ‘in the money’ at expiration. To determine this, market participants use implied volatility, which reflects how much option traders believe the price of a stock or ETF will move over the course of a year.
Generally, the higher the implied volatility, the more expensive the option price. So if you are looking for a dividend stock and want to add a covered call, you would prefer that the implied volatility on that option is at the high end of the historical range you evaluate.
You can analyze the historical levels of implied volatility by using a charting service that provides historical implied volatilities. One of the most prevalent instruments that reflect implied volatility is the CBOE Volatility Index (VIX Index). The VIX measures the implied volatility of the at the money (ATM) strike prices on the S&P 500 index. A strike price is considered ATM, when the stock price and the strike price are the same.
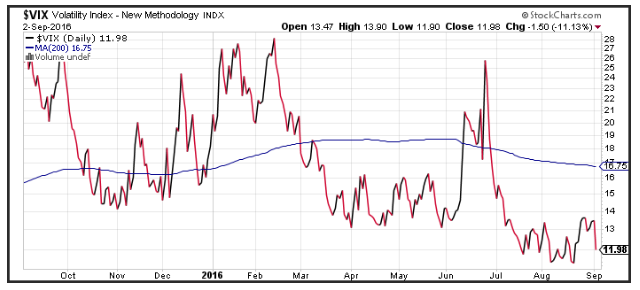
Similar to the way you might evaluate the chart of a stock, you can employ the same techniques to analyze a chart of implied volatility. While each trader may use a different methodology to evaluate price action, most of us are looking to buy low and sell high.
Finding relatively rich premiums to sell can be accomplished by using a scanner to search for elevated levels of implied volatility. One technique is to look for implied volatility levels that are near their 52-week peaks. A quick scan of the stocks in the S&P 500 index reveals that General Mills (GIS ) is in the top ten of implied volatilities near their 52-week highs.
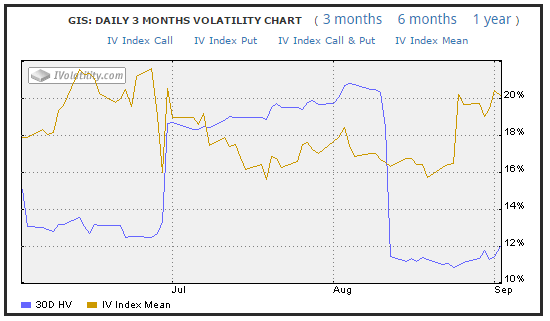
The picture of implied volatility shows it’s near the upper end of the 3-month range.
General Mills has not announced its next dividend payment date, but it is likely around October 7, 2016, given recent history. One strategy is to sell call options that have expiration dates beyond the dividend date of a stock you own. These options are attractive as the option buyer can then receive the dividend payment if they call away the stock.
Once you find a stock that looks attractive as a dividend candidate, you should evaluate three criteria to see if the risks equal the rewards.
The first, as we discussed, is whether the implied volatility is high relative to recent history. This can help you decide if the option’s premium is rich or cheap. The second is whether there is enough liquidity to sell the option and buy it back without paying away a large bid/offer spread. To do this, you can analyze the open interest. As a guide, look for options with more than 100 contracts of open interest. Lastly, you need to evaluate the likelihood your stock will be called away. The further away the strike price from the current price, the better chance you have of holding onto your stock.
Recall, if you sell a covered call, the buyer of the call can exercise the option and you are required to sell him your stock at the strike price of the option.
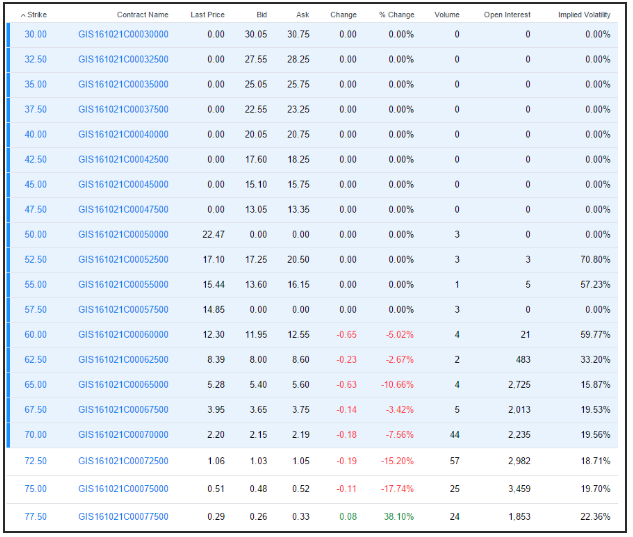
The option chain of GIS shows a number of options that have robust levels of open interest. As an example, if you decided to choose an out of the money call to sell, such as the October $72.50 call, you could receive $1.03 in a premium. As of writing this article, there are 45-days until expiration. GIS is expected to deliver $1.92 in dividend payments over the course of the year, or $0.48 per quarter.
Understanding Payouts
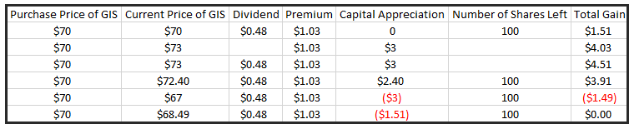
Here are a few scenarios that could occur with a covered call overlay, using GIS as an example. To illustrate, we are assuming you purchased 100 shares of GIS stock.
- The stock price remains at your purchase price of $70.
- You would receive a premium of $1.03, as well as a dividend of $0.48.
- You retain all of your shares.
- The stock price moves above the strike price, to $73, and gets called away before the dividend is paid.
- Here you would receive your premium of $1.03.
- You would also accrue a capital gain of $3 per share (the difference between your purchase price and the strike price is your capital gain $73 – $70.)
- The stock price moves up to $73 and is called away after the dividend is paid.
- Here you would receive your premium of $1.03, as well as your dividend of $0.48.
- You would also accrue a capital gain of $3 per share (the difference between your purchase price and the strike price is your capital gain $73 – $70.)
- The stock price rises near the strike price, but remains below it, at $72.40.
- Here you would retain the stock and receive the premium of $1.03, along with the dividend of $0.48.
- You would also accrue an unrealized capital gain of $2.4 per share (the difference between your purchase price and the strike price is your capital gain $72.4 – $70.)
- The stock price drops to $67.
- Here you would retain your stock and receive a premium of $1.03, along with the dividend of $0.48.
- You would also have an unrealized capital loss of $3, which is somewhat offset by the premium and the dividend.
- Break even – the stock price drops to $68.49.
- Here you would retain your stock and receive a premium of $1.03, along with the dividend of $0.48.
- You would also have an unrealized capital loss of $1.51, which is offset by the premium and the dividend.
The Bottom Line
By selling a covered call, you are giving up future capital appreciation by providing the right to purchase the stock at a specific price. The benefits of receiving additional income, – in the form of a premium – not only protects you from declines in the price of the stock, but it can add considerably to the income you receive from holding a dividend-paying investment.


