
The term “transport stocks” refers to companies that are engaged in the movement of raw materials and consumer goods from one location to another. While some may choose to include airline companies and auto manufacturers under the transports umbrella, this guide is focused more around the firms that primarily deal with the transport of goods across the global economic supply chain.
What Are Transportation Stocks?
Transport stocks span a variety of sectors, covering everything from railway shippers to trucking companies to firms that have no shipping assets but instead provide logistics. This makes the transport sector one of the more diverse families in the equity market. Because of its wide reach and dependence on multiple sectors within the economy, the transport industry can be challenging to analyze for both beginners and seasoned professionals.
Be sure to also see our Cheatsheet to Analyzing Retail Stocks
Transport stocks are closely monitored by experts and investors alike, seeing as how the domestic logistics and transportation industry totaled $1.33 trillion in 2012, accounting for about 8.5% of Unites States’ annual gross domestic product. Given its size and scope, being aware of major trends in the transport industry may give you better insights into the overall health of the U.S. economy.
Knowing the various factors impacting the transport industry is only half the battle; being aware of each sub-sector’s nuances is challenging, but equally important.
How Are Transportation Stocks Classified?
The transport industry spans far and wide, and as such, the first step to analyzing it revolves around breaking it down into broad categories. For the most part, transport stocks fall into one of these five families:
Logistics Services – This includes companies that provide inbound and outbound transportation management, operating everything from warehouses to fleets to inventory management. In other words, these firms don’t actually own or operate shipping-related assets like ships or trucks; instead, they offer support and logistics services to those companies that do.
Air Delivery – This includes companies that offer time-sensitive and end-to-end transport services for everything from documents and parcels to more high-value items. These firms also tend to service smaller businesses that don’t necessarily have the means to operate their own supply chain.
Freight Rail – This includes companies that ship high volumes of heavy cargo across long distances. These firms haul an estimated 15% of the total tonnage shipped across the country, and an estimated 70% of all U.S. coal shipments are delivered via freight rail; furthermore, this mode of transit accounts for approximately one-third of all U.S. exports.
Maritime – This includes companies that move goods and materials across water, generally between continents, through the use of carriers and other cargo-carrying vessels. Water transportation is at the backbone of the global economy and this mode of transit accounts for nearly 80% of U.S. exports by tonnage.
Trucking – This includes companies that ship goods and materials across varying distances via semi-trailers and other cargo-carrying trucks. This mode of transit is incredibly popular given its accessibility and relatively low capital requirements compared to most other freight and maritime shipping options; in fact, it is estimated that trucking moves about 70% of all tonnage transported domestically.
The table below lists some of the biggest companies operating in the transport industry:
| Ticker | Name |
|---|---|
| (CHRW ) | C.H. Robinson Worldwide |
| (EXPD) | Expeditors International |
| (UPS ) | United Parcel Service |
| (FDX) | FedEx |
| (NSC ) | Norfolk Southern |
| (CSX ) | CSX Corp |
| (JBHT ) | J.B. Hunt |
| (LSTR ) | Landstar Systems |
| (NMM ) | Navios Maritime Partners L.P. |
| (FWRD) | Forward Air Corp |
How Do Transportation Stocks Fit into a Dividend Portfolio?
Dividend investors can utilize transport stocks in a number of ways, but it is important to first recognize the varying degrees of cyclicality that companies in this industry tend to exhibit. Consider the table below, which compares the most popular investment factors of the transport industry, as represented by the Dow Jones Transportation Average Index, relative to that of the broad stock market, as represented by the S&P 500 Index:
Please note data is as of 1/9/2015
| Investment Factor | Dow Jones Transportation Average Index | S&P 500 Index |
|---|---|---|
| Beta | 1.16 | 1 |
| Annual Dividend Yield | 0.73% | 1.90% |
| 5 Yr. Average Annual Return | 22.45% | 16.79% |
| 10 Yr. Average Annual Return | 11.50% | 8.00% |
| 200 Day Volatility | 17.90% | 13.00% |
As the table above showcases, as a whole, the transport sector is more volatile than the broad equity market. On average, transport stocks can be expected to deliver greater capital gains and smaller dividends when compared to that of the broad market; notice how the Dow Jones Transportation Average Index boasts impressive 5- and 10-year annualized returns, while its dividend yield comes in well below that of the broad equity market. Furthermore, the transport index boasts a higher beta and 200-day volatility than the S&P 500, which are two common metrics used to measure risk.
Read more about Dividend Friendly Industries.
Consider the cumulative returns comparison chart of the two benchmarks below spanning from January 2000 through December 2014; please note the Dow Jones Transportation Average Index in blue and the S&P 500 Index in red.
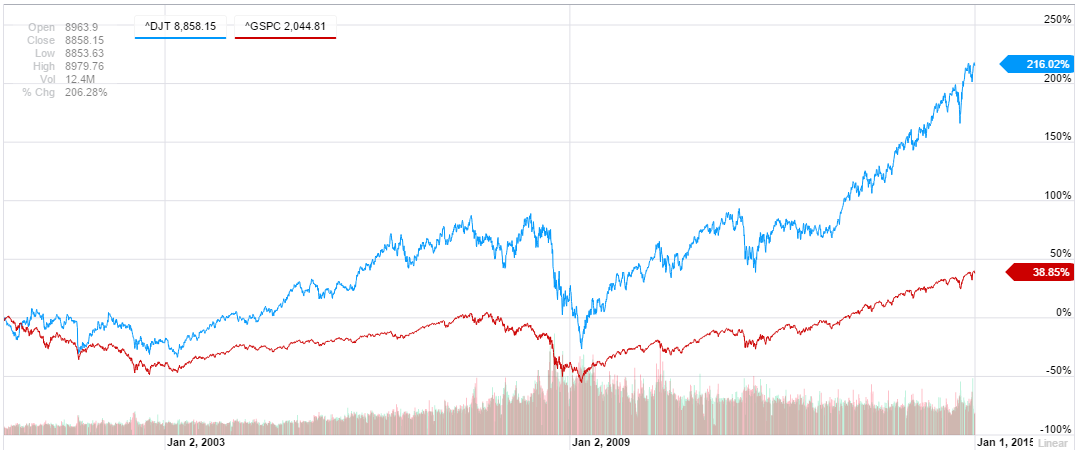
The cyclical nature and above-average volatility of the transport industry is showcased quite clearly in the graph above. During the bull market spanning from 2002 through 2007, notice how the transport index surged well ahead of the broad equity market. Likewise, notice how the transport index sank more sharply during the 2008 downturn compared to the pullback seen in the broad equity market. Fast forward to the ongoing bull market today, and we see that the transport index has again managed to surge well ahead of the S&P 500.
See also an Illustrated History of Every S&P 500 Bear Market
The takeaway here is that transport stocks are cyclical in nature, and as such, they are more sensitive to economic fluctuations and tend to exhibit more radical swings compared to the broader market.
Stocks in this industry tend to lead during times of economic expansion, and likewise, they tend to fall more during times of economic contraction. The reason behind this is quite straightforward; during the early stages of economic recovery, business will start to ship more goods in anticipation of improving business conditions. On the flip side, a decline in shipping demand is often a signal for economic weakness ahead, as evidenced by businesses scaling back on their expenditures.
The Most Important Economic Indicators That Impact Transportation Stocks
When taking a deep dive into any industry, it generally helps to start with a top-down approach so you get a clearer “Big Picture” perspective before starting to compare company-specific metrics. Specifically, when it comes to analyzing the transport industry, it’s good practice to start by examining the biggest macroeconomic trends at hand.
The following set of indicators is useful for gauging longer-term macroeconomic trends and is helpful to identify where we currently are in the business cycle. We want to know where we are in the business cycle so we can take advantage of the transport stocks that are historically best adept at performing well during a particular phase.
Be sure to see the 7 Books That Will Make You a Better Dividend Investor.
GDP: Gross domestic product is easily one of the most followed and important indicators because it is an aggregate measure of total economic production. Furthermore, because the GDP report covers personal consumption, government purchases, corporate profits, and the foreign trade balance, this indicator sheds a lot of light on the overall investment landscape. Seeing as how GDP encompasses all economic production, it shouldn’t come as a surprise that the health of the transport industry is closely correlated with this indicator.
Consider the graph below, which showcases the year-over-year quarterly percent changes of GDP (blue line, left axis) versus the Dow Jones Transportation Average Index (red line, right axis) spanning from 2006 through 2014:
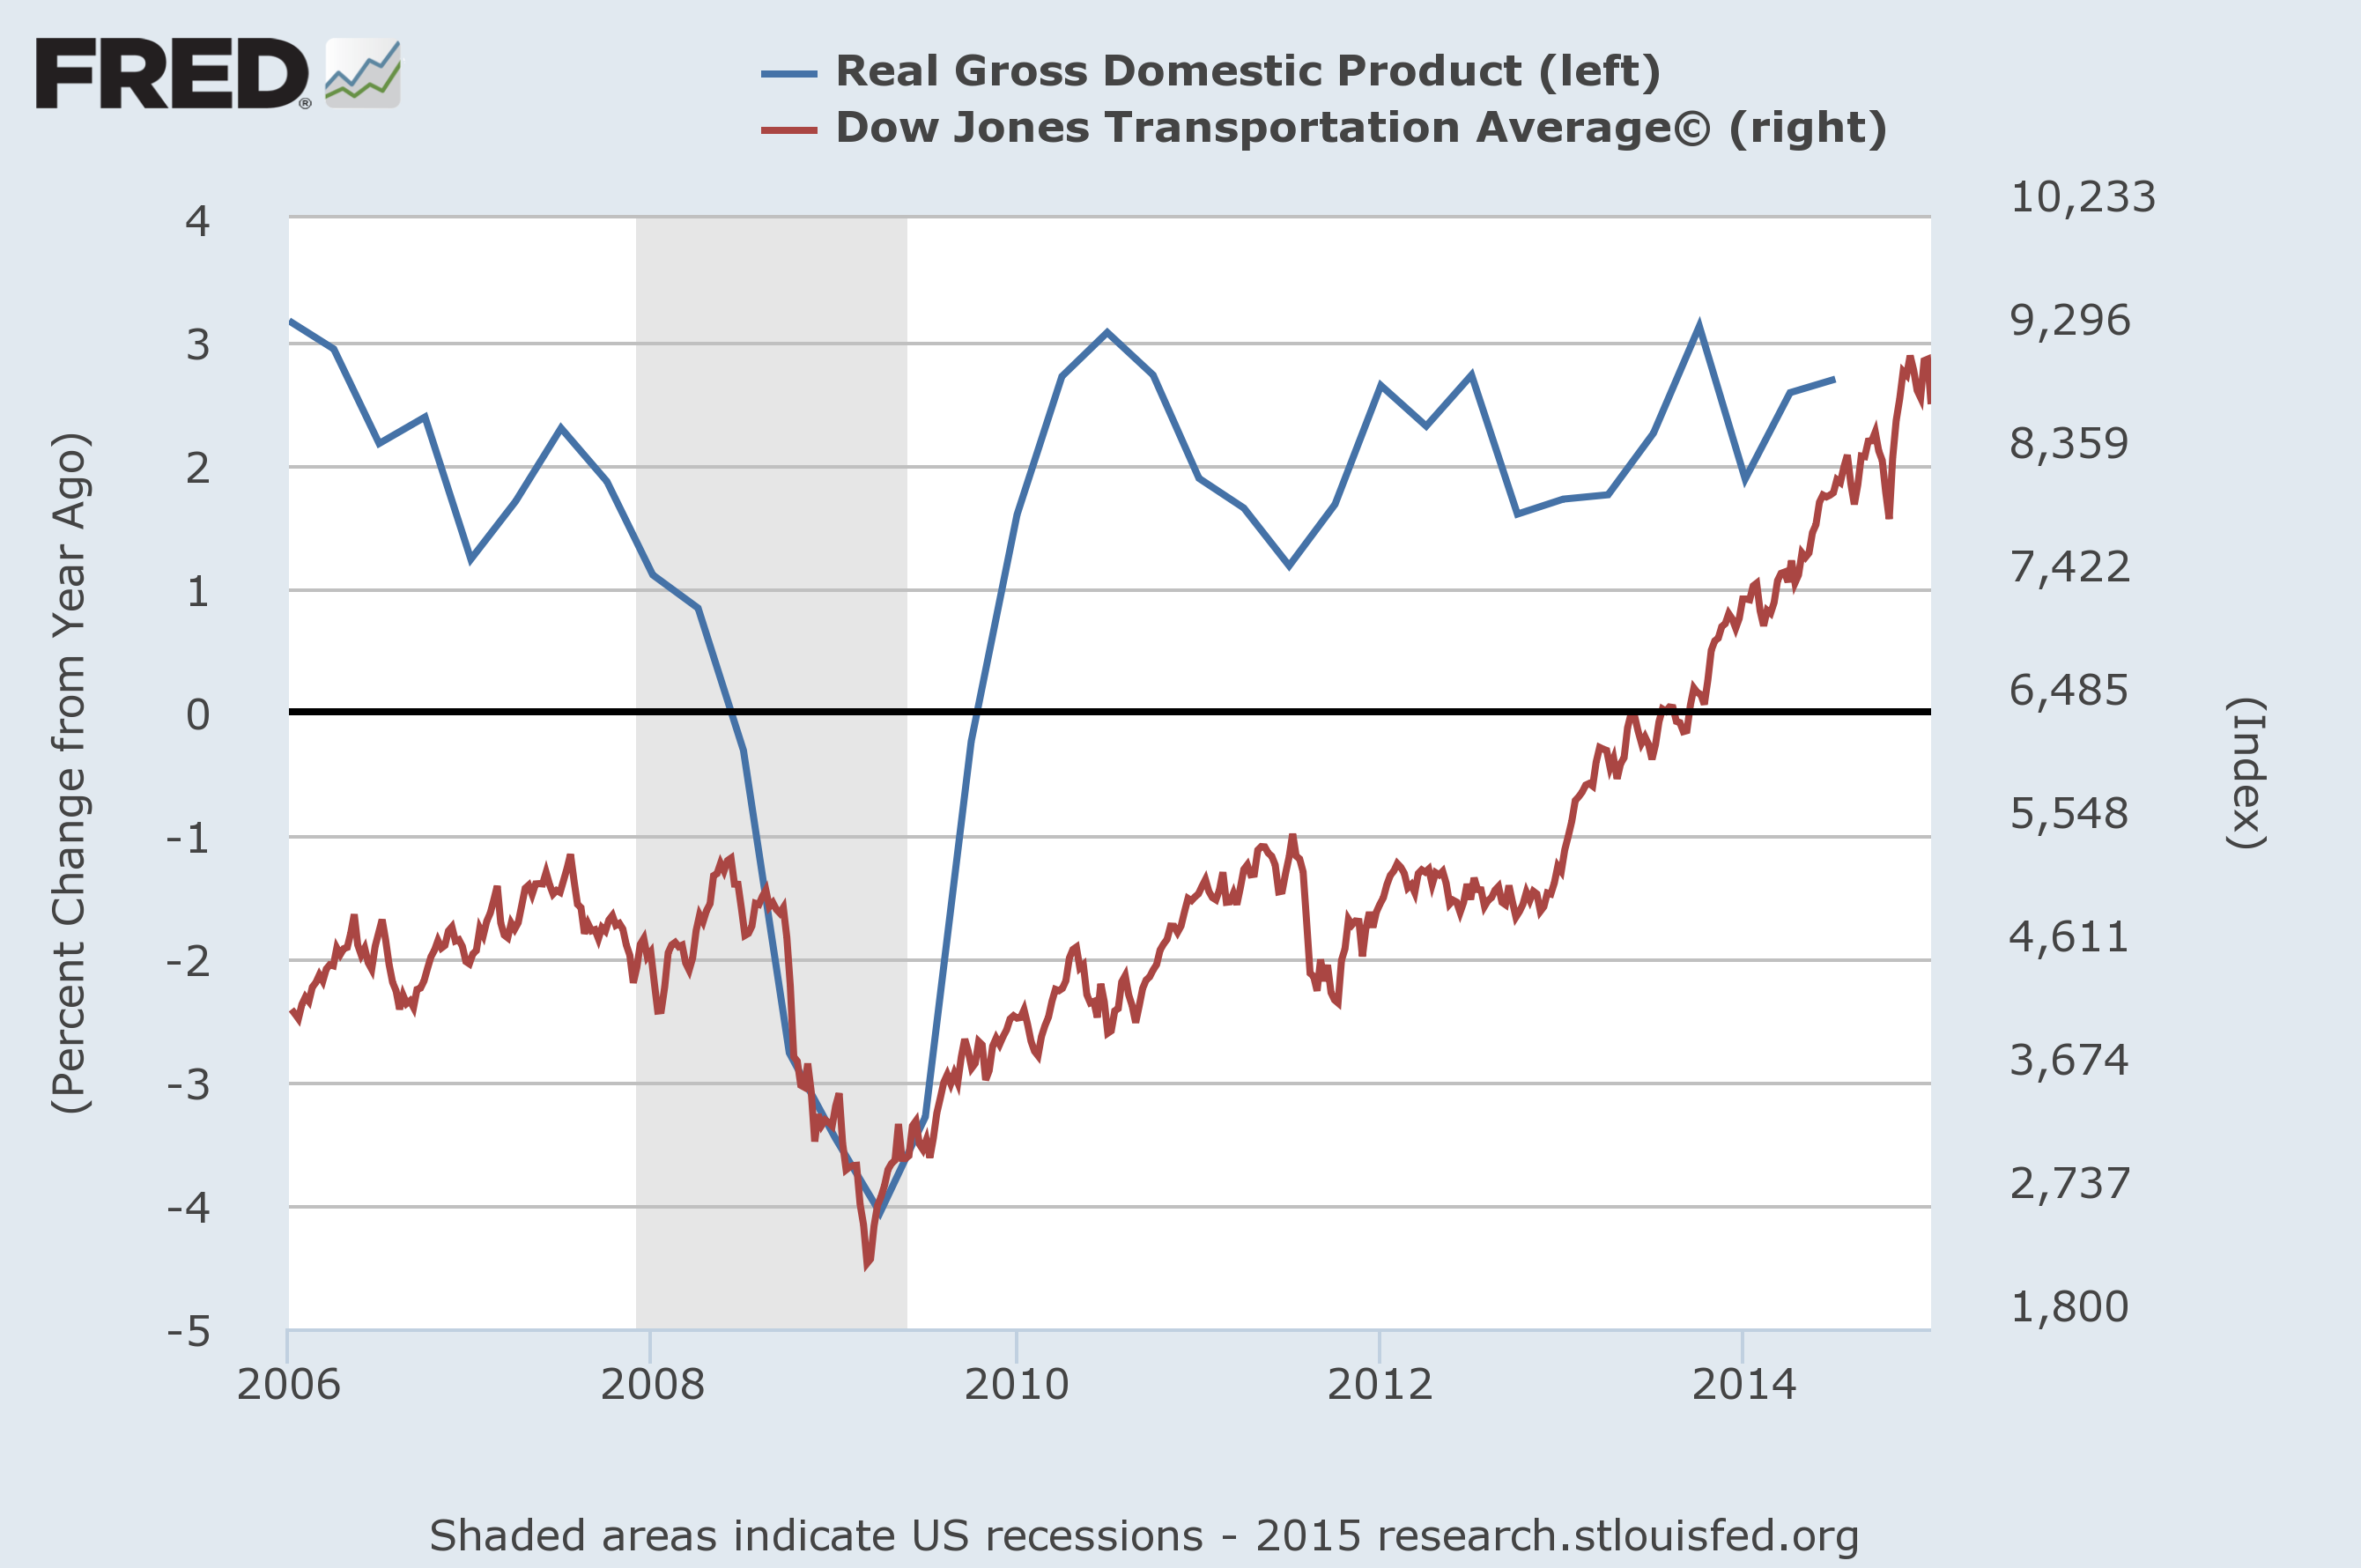
Notice how the transport index peaked as GDP growth crossed below the zero line and into negative territory during the third quarter of 2008; in the months following, GDP growth deteriorated even more and the transport index followed suit by sinking sharply lower. Lastly, notice how the transport index began to recover after GDP growth bottomed out in early 2009.
Investors cannot get any stock-specific insights from monitoring GDP, but it will help them form a more educated opinion on the current state of the economy. If GDP growth appears to be slowing or even turning negative, investors may wish to consider reducing their exposure to transport stocks as they are likely to suffer more than the broad market during periods of economic contraction.
See also 5 Stocks That Are Bellwethers for the U.S. Economy.
Interest Rates: The interest rate cycle is inherently tied to the economic cycle as both the availability and affordability of credit play a major role in driving business expenditures and personal consumption, both of which in turn drive shipping demand for raw materials and goods. If interest rates are low, and we’re not in a recession, investors can expect consumer and business expenditures to remain strong, which should in turn fuel demand for shipping and resonate well for companies in the transport industry.
Baltic Dry Index: The BDI Index, created by the London-based Baltic Exchange, is an essential indicator for anyone looking to assess the state of the global economy. This index measures changes in the cost to ship various commodities, such as metals, grains, and fossil fuels, by sea. The index is compiled by taking the average price of 22 different shipping routes around the globe for various ship sizes.
Seeing as how the index is focused around raw materials, it is regarded as a leading indicator; this is because companies will increase their demand for commodities when they expect to start producing and selling more finished goods. Likewise, companies will dial back their demand for raw materials when economic uncertainty is on the horizon. As such, the BDI tends to move in tandem with demand for raw materials, which in turn can serve as a leading indicator for which way the global economy might be headed.
Cass Freight Index: The Cass Freight Index, created by payment processor Cass Information Systems (CASS ), is an essential indicator for monitoring national shipping activity. This index measures the actual freight expenses of hundreds of large shippers and includes all domestic freight modes. The diversity of the companies included in the index coupled with the aggregate freight volume is said to provide a valid representation of shipping activity in North America.
Consider the graph below, which showcases the Cass Freight Index (blue line, left axis) and the Dow Jones Transportation Average Index (red line, right axis) spanning from 2006 through 2014:
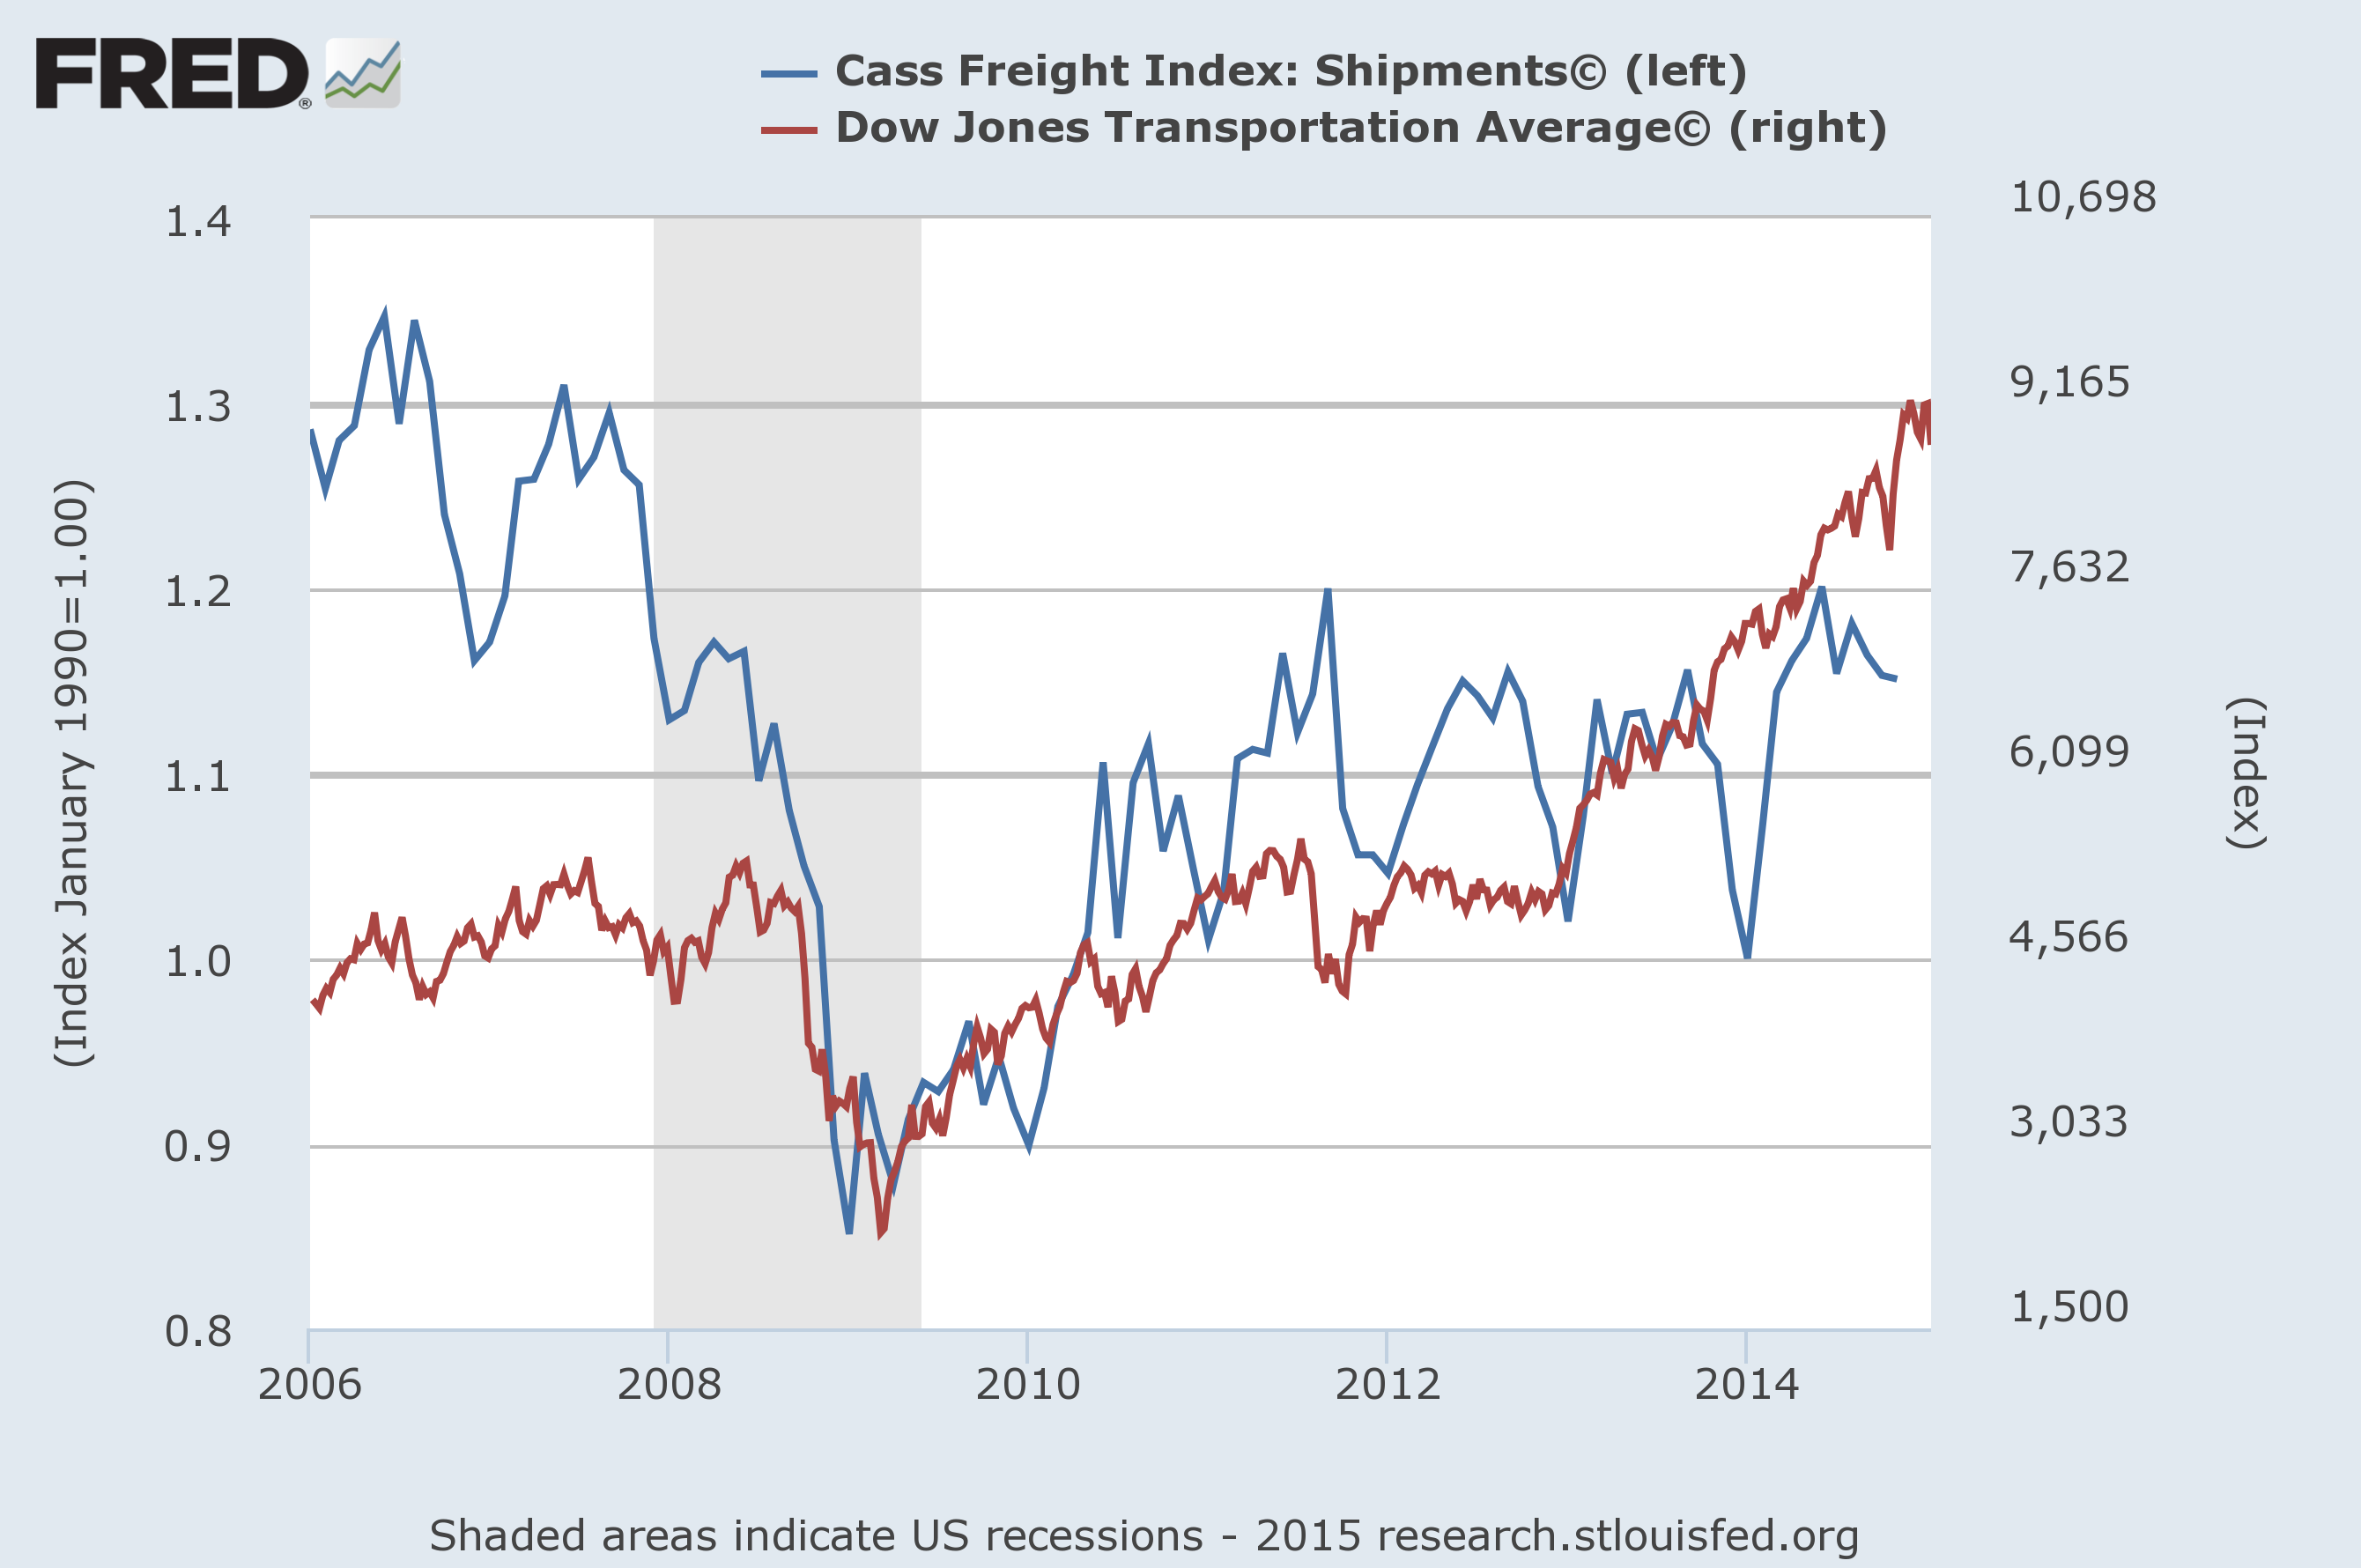
This index is regarded as a leading indicator, and the chart above showcases this quite clearly. Notice how the freight index peaked in 2006 and went on to post a lower-high in 2007, suggesting weakness in shipping activity; the transport index itself did not peak until 2008, after which it proceeded to sink sharply lower as evidence of an economic slowdown mounted.
The Most Important Financial Ratios Used to Analyze Transportation Stocks
The sheer variety of companies that fall under the transport umbrella makes it harder to analyze them with a standardized approach because each of the various sub-sectors has its own set of nuances to keep track of. Nonetheless, there are certain fundamental metrics that investors should keep a close eye on, which have inherent value when it comes to offering insights to aid the transport stock selection process.
Debt-to-Equity: This metric, which measures a company’s financial leverage, is an important one to monitor when comparing transport stocks since their operations tend to be very capital-intensive. Companies with a relatively low debt/equity ratio can be expected to weather an economic downturn much better than those who have been more aggressive in financing their growth with debt.
Net Asset Value per Share: The cyclical and seasonal nature of the transport industry makes it difficult to rely on a traditional price/earnings (P/E) comparison between companies. As such, some analysts recommend looking at the net asset value (NAV) per share; this is the market value of the shipper’s assets, minus net debt, plus equity interest. A transport stock is said to be undervalued when it is trading below its NAV/share; likewise, investors are said to be “paying a premium” when a company’s share price is above this valuation metric.
Other Free Tools and Resources for Analyzing Transport Stocks
Consider the following resources in addition to the ones mentioned throughout the article when doing research on the transportation industry:
The Bottom Line
As this guide highlights, the transportation industry spans a variety of sub-sectors, each of which has a particular set of nuances. In addition, investors must also be aware of economic and nonfinancial factors that may affect these transport companies. As always, we encourage investors to do their own research to find the best transport stock.


